Business reports should not look like a long “phonebook”-style list of items. Rather, they should quickly expose the most important data elements, topmost important variances, etc. That is why all Zebra BI visuals offer practical functions for displaying Top and/or Bottom N elements that will make your reports and dashboards much more focused and actionable.
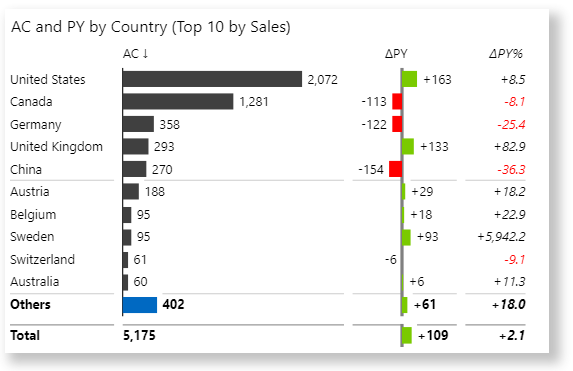
All Zebra BI visuals offer the Top N + Others functionality. In Zebra BI Tables you can use it to display for example Top 10 or Top 20 most important elements in your rows (either by value or by the variance), while all other small elements are automatically summed up into a new row called Others. Here’s a classic example:
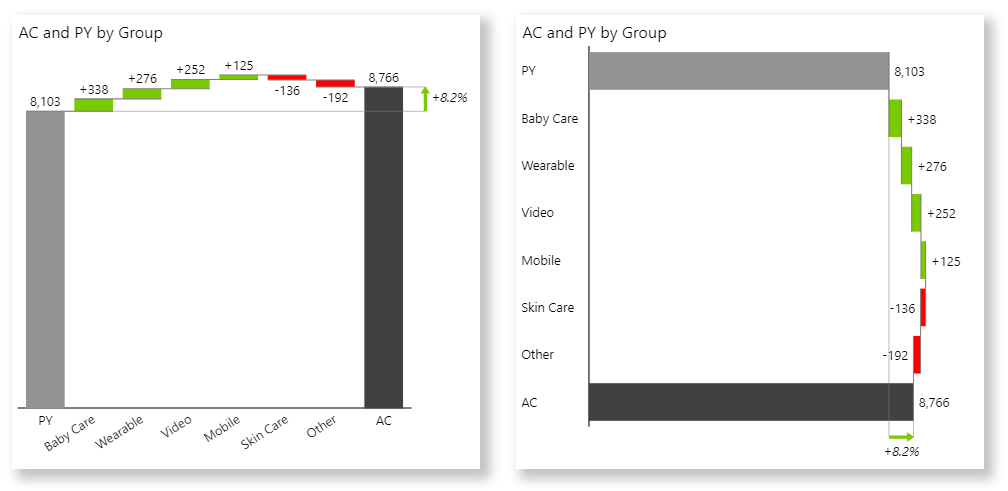
In Zebra BI Charts, this feature is available in small multiples (showing the top biggest charts) and also in waterfall charts (showing the most important variances while others are summed up automatically).
NOTE
It is important to distinguish between native Power BI filters where you can filter top elements in a data field and the Zebra BI Top N + Others feature. While Power BI’s filter only allows you to filter out a fixed number of elements in a selected data field, Zebra BI also aggregates and displays the total value of the suppressed elements (Others) so that you have a clear understanding of how important they are. Also, the elements displayed will always add up to the grand total.
In addition, Zebra BI offers more options for filtering (by any value or by any variance), allows you to select top elements either by the number of elements or dynamically by a given percentage of total value, and provides options to filter by Top, Bottom and even Top and Bottom elements.
Watch how use Top N + Others feature
Let’s explain this further with a few practical examples.
Top N + Others in Zebra BI Tables visual
To turn on Top N + Others in Zebra BI Tables, right-click on your data categories, and select Top/Bottom N from the context menu:
On top of filtering out the top elements, the Zebra BI Tables visual will also automatically calculate and display the Others row.
You can further highlight the Others row by right-clicking on the Others element name and ticking the Highlight checkbox:
Every user (including a viewer or a consumer in the view mode!) can quickly change the number of top elements displayed by simply clicking on the up/down button next to the Others:
To remove or change the Top N filter, just right-click on any category name again and select the desired option from the Top/bottom N drop-down menu:
You can set the filter to Top N elements, Bottom N elements, and also Top & Bottom elements. Similarly, you can choose to filter by the value (e.g. actual sales), absolute difference, or relative difference:
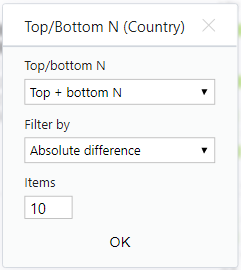
A very interesting and useful option in business reporting is to filter by the most important variances (either positive or negative). You can achieve this by setting the filter to Top + bottom N and filter by Absolute variance:
This will effectively expose the most important variances in your data, that have contributed either positively or negatively to the total variance.
Applying Top N in hierarchical tables
If you have a hierarchical table (two or more data fields in rows), then you can enable the Top N on a selected level in your hierarchy (specific data field in your categories) or even turn the Top N on several data fields at once!
In the following example, the Zebra BI Tables visual contains two data fields (BusinessUnit any Country) and both of them have the Top N filter turned on. This, the table shows Top 3 business units (+ others) and then Top 5 countries within each business unit (+ others):
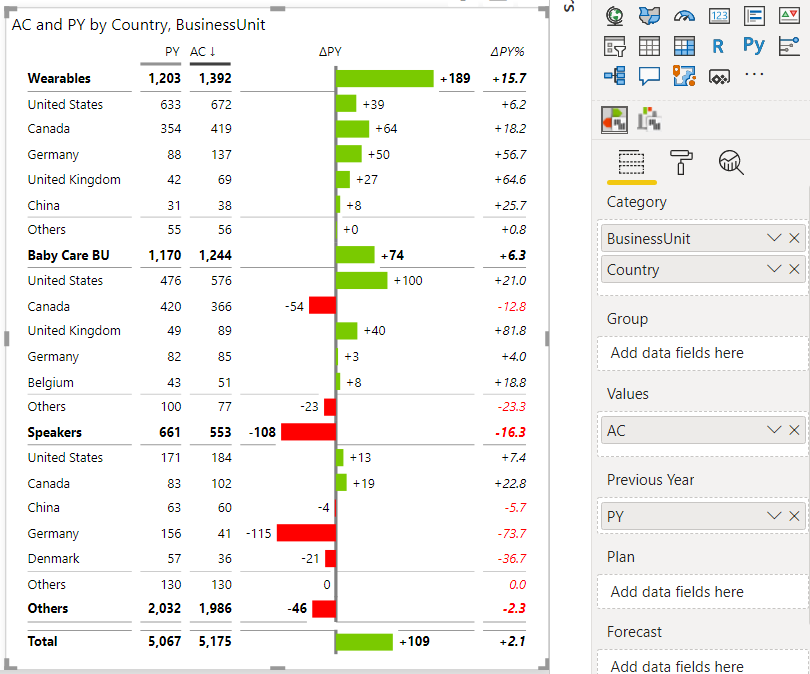
To achieve that, simply right-click on any element of the data field that you want to filter, e.g. on a country name to set the Top N filter by country or on a business unit to set the Top N by business units.
With the 6.2 update of the Zebra BI Tables visual, you can also use the Top N + Others feature in hierarchical tables with 3+ levels. This gives greater visibility and lets you focus on the right data.
Simply right-click on any of the rows and select the Top/Bottom N feature. When it opens, select to which level you wish to apply the feature, choose between Top N + Others, Bottom N + Others, or Top/Bottom N + Others, and specify the number of entries that should be visible in the Edit or View mode.
Explaining variances by using Top N in a tooltip
The Top N functionality of Zebra BI works great in report page tooltips. Namely, since the tooltips should remain small, it is crucial that you are able to display only the most important information in them. Zebra BI’s Top N function will help you achieve that.
Let’s observe the following example that provides a quick explanation of variances in a report page tooltip. The tooltip contains a Zebra BI Table with Top + Bottom 7 countries by absolute variance:
To create report page tooltips like this, please check out our step-by-step video tutorial:
Using Report page Tooltips.
Showing only Top N charts + Others in small multiples
You can turn on the Top N function also in small multiples.
To do that, navigate to the Small multiples group of settings and switch the Top N setting from Off to Items (to display exactly a desired number of top charts) or Percentage (to display the top N charts that contribute to the desired percentage of total value):
The Top N function in small multiples works especially well in a typical business situation, where you have a lot of charts and they vary in size:
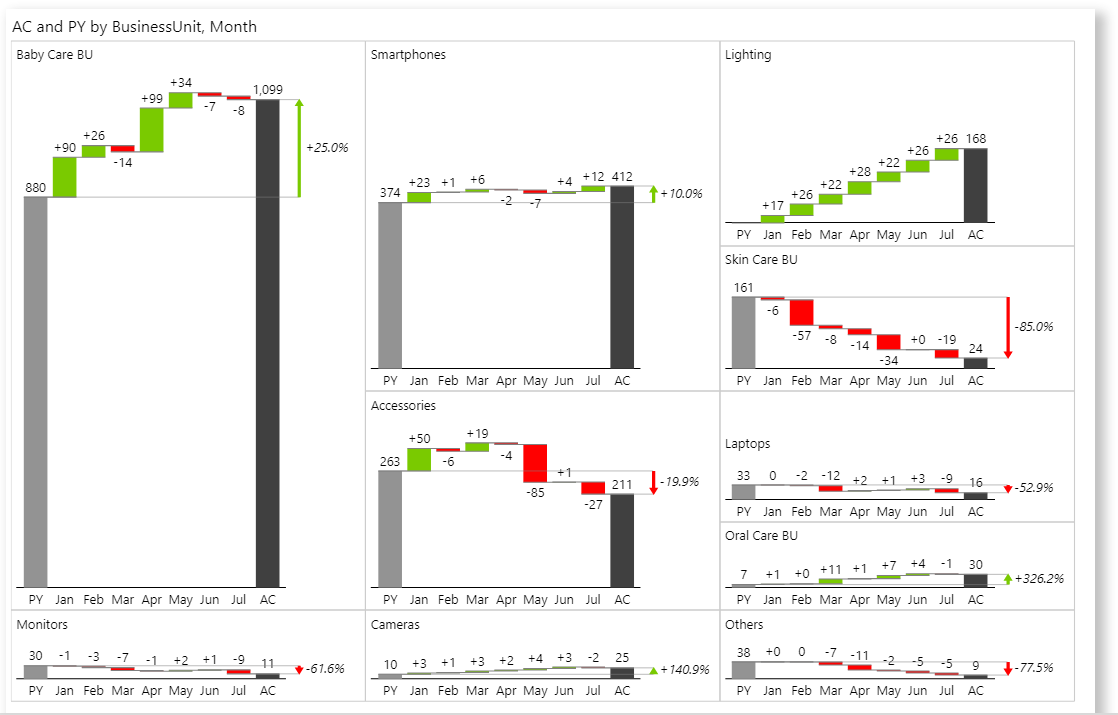
Using Top N + Others in waterfall charts
The last place where Zebra BI offers a special Top N function is in the waterfall charts:
To enable Top N in waterfall charts, turn on the Top/bottom N (and optionally select the number of variances you want to see displayed):
As illustrated above, Zebra BI will filter out the desired number of variances that have the largest variance (either positive or negative!), sort them automatically in the chart and add an automatically calculated element called Others.
Using Top N in Focus mode
The Top N functionality enables you also to define a different number of categories that are displayed when you are in Edit mode or in Focus mode. In the latter case, you want to display more detailed information and you can now choose to display more categories. Whereas in Edit mode you want to keep your report as concise as possible, and you can choose to display fewer categories.
To apply this setting follow the steps below:
- Click on the category name and select Top/Bottom N.
- By default, it is turned Off so select Top N from the dropdown.
- Define how many categories should be displayed in each mode and click OK.
- After the pop-up with the settings closes, click on the icon for Focus mode in the top right corner.
- Review your choice in Focus mode as well and if needed, adjust the number of categories displayed directly there by following these same steps.
This update was part of the 5.3 update of the Zebra BI Tables visual.