Zebra BI Cards visual allows you to display and compare KPI cards side-by-side. Thanks to Scaled groups option you can group related KPIs and smoothly present them as equally scaled cards.
When you want to compare certain values, the visualizations might look quite similar at first glance. However, often the problem is that different KPIs that you wish to compare are not properly scaled. As a result, the data is misinterpreted.
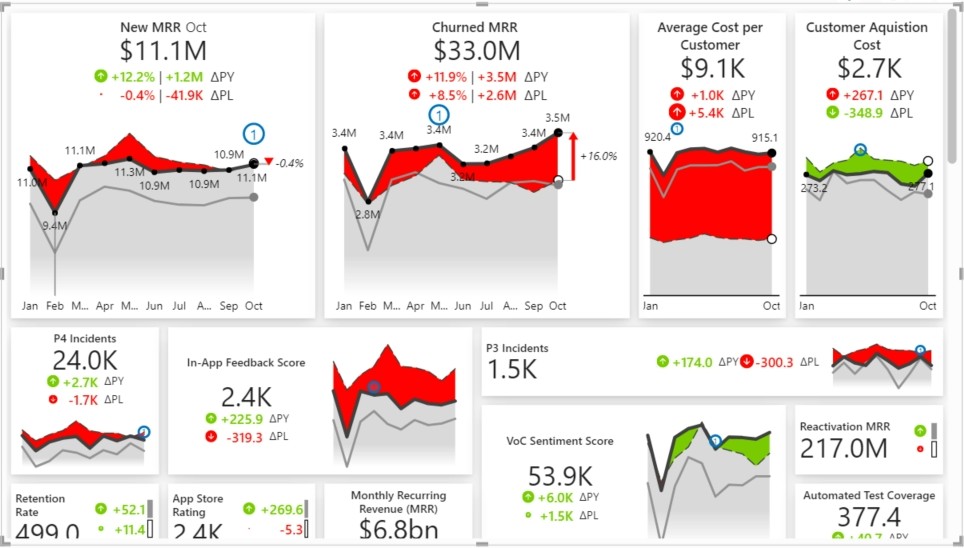
If you look at the New MRR and Churned MRR or Average Cost per Customer and Customer Acquisition Cost on the screenshot below, the first impression is that their performance is quite similar. However, there is a considerable difference in their absolute values (11.1M to 33.0M and 9.1K to 2.7K). To put the charts into the right perspective, you can use the Scaled groups functionality.
Go to the top part of the selected card and click on the middle icon. This will open the Scaled group option.
Simply select all the cards that you want to put in one group. Zebra BI will automatically synchronize the Y-axis across all the selected charts. This is extremely important because only properly scaled charts enable true visual comparisons between data categories.
You can make as many Scaled Groups as you want to. Furthermore, you can change the color for each group in the Scaled Groups menu to better differentiate between them.