Power Query Editor is the ETL tool of Power BI. ETL stands for Extract, Load, and Transform. In this article, we will focus on T – Transform.
First, let’s also see what E – Extract, T – Transform and L – Load actually mean:
E – Extract: Before you have data in Power BI, it needs to be extracted from a source system. This could be an Excel file, a web-based service, an ERP system, or some other source. Luckily there are a lot of predefined connectors in Power BI so the extraction part of ETL is something that happens more or less automatically once you have selected the correct connector for your data source. Want to learn more about data sources?
T – Transform: The data in the source system might not be exactly the way you want it. You might want to add new columns, remove existing columns, add conditions, calculations, or just change the format of the data. These and many more transformations can be done in Power Query Editor.
L – Load: The load is something you don’t need to worry about, as Power Query Editor and Power BI are fully integrated, the load from Power Query to Power BI happens with the click of a button.
Power Query Editor is a very powerful tool and there are limitless transformations that you can do. This article will not make you a Power Query Editor pro because then, we would have to go into details about the M language (Yes, the language of Power Query is called “M” and no, it has nothing to do with M from James Bond. At least not that we know…). This article focuses on some of the main functionalities with which you can already do a lot of transformations.
Before we start, we should mention that there’s also an interesting Knowledge Base article that shows some best practice rules which apply to all Power BI reports and should always be followed in Power Query Editor.
Use the first row as header
Tables in Power BI always have a header so they can be easily identified. Most of the time, Power BI automatically detects the first row of the table as the header when importing the data. But depending on the content of the table, Power BI might not detect the header.
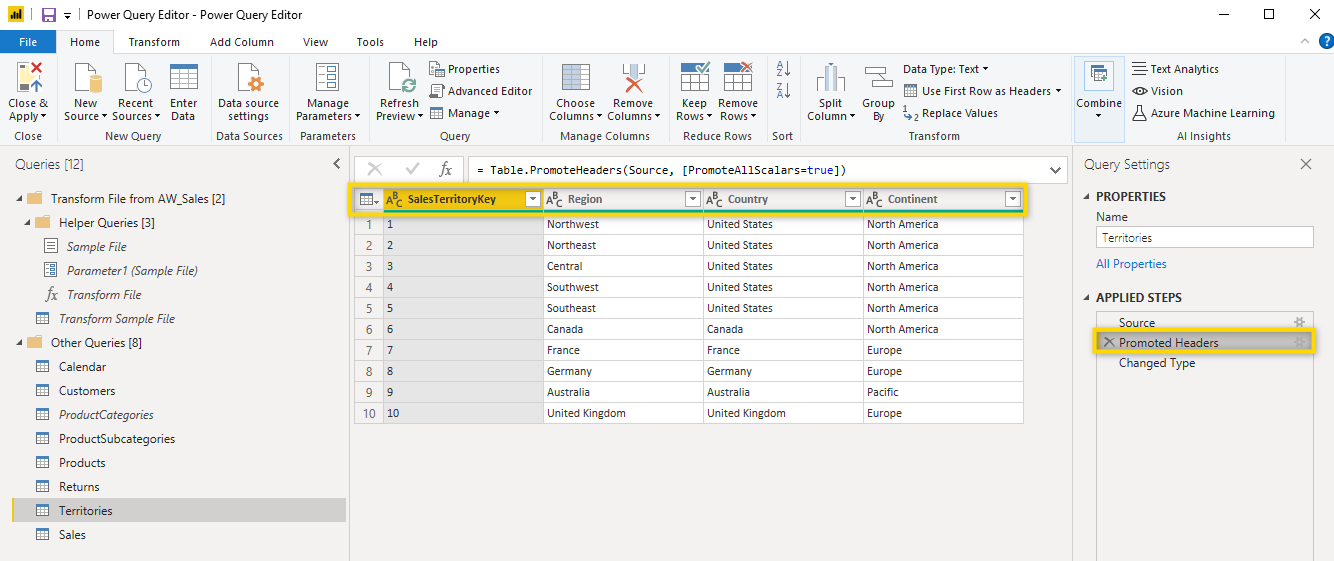
In the screenshot below, the headers are correct and you can also see that Power BI has automatically created the step Promote Headers.
When Power BI doesn’t detect the header, the same table looks like this:
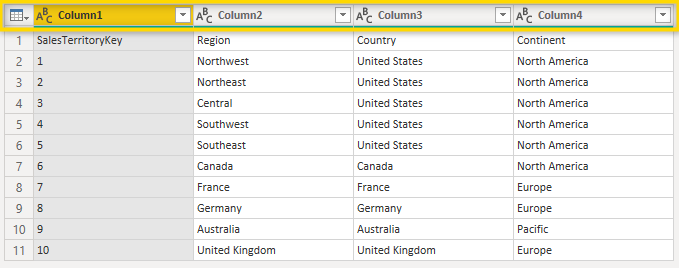
You can see that the columns are called Column1, Column2, etc. and in row one, you have the actual names of the columns which should be in the header.
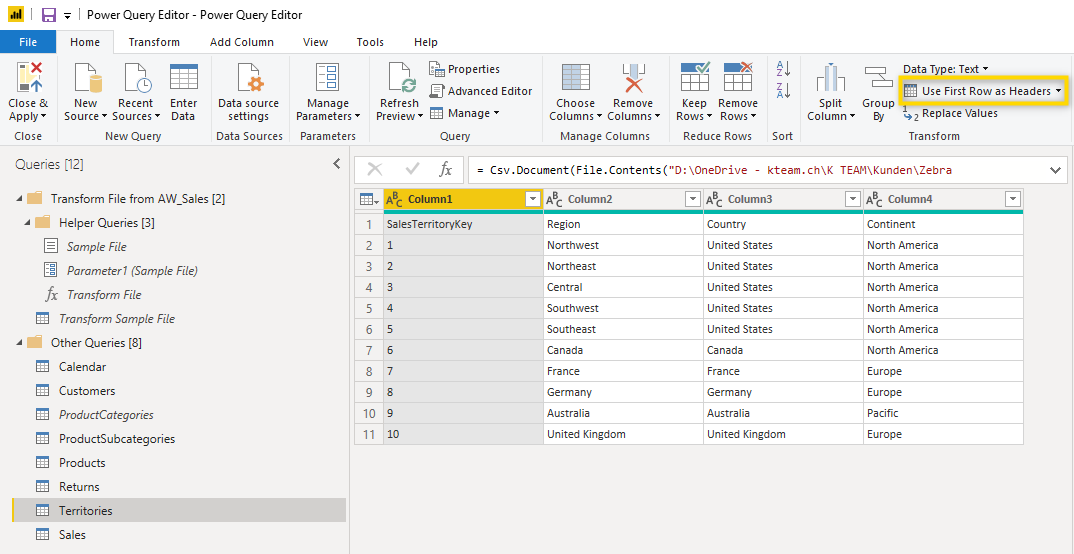
To turn the first row into the header, simply click on Use First Row as Header.
Remove Columns / Choose Columns
In general, it’s best to remove all columns which are not needed for the report before loading the data to Power BI. The reasons for that are that having unneeded columns in the data model might slow down the report and it can also make it more difficult to find what you’re looking for. Keep in mind that the removal of a column can easily be undone.
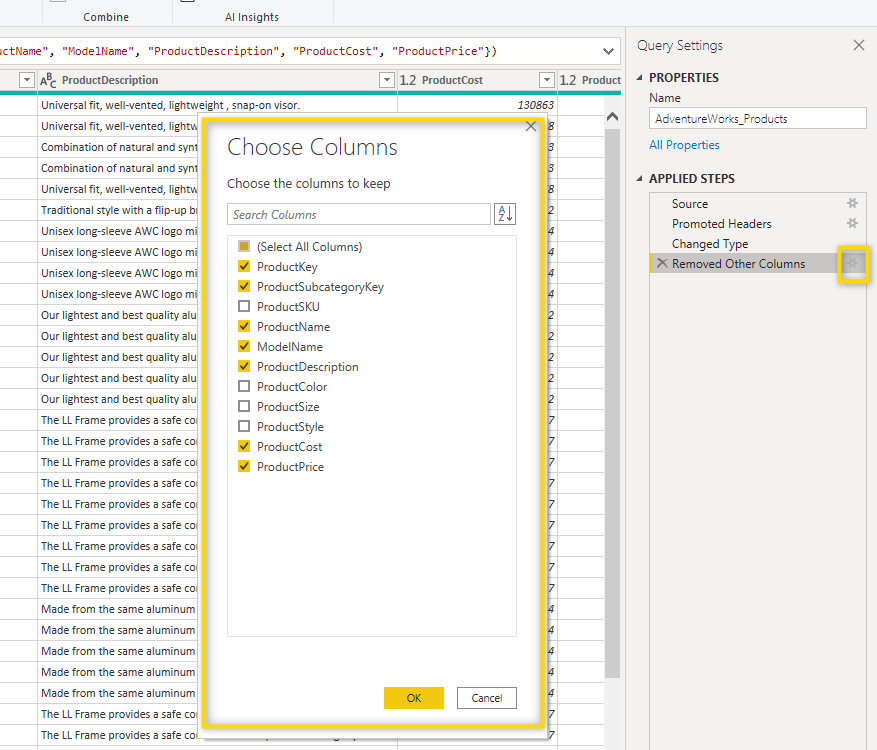
There are different ways of how to remove columns. We recommend you use the Choose Columns function because once it is applied, it’s still very easy to change. So let’s assume that you are in Power Query Editor and have selected a table for which you don’t need to load all columns to the Power BI report. All you need to do is select Choose Columns from the Home menu and unselect the columns which should be removed.
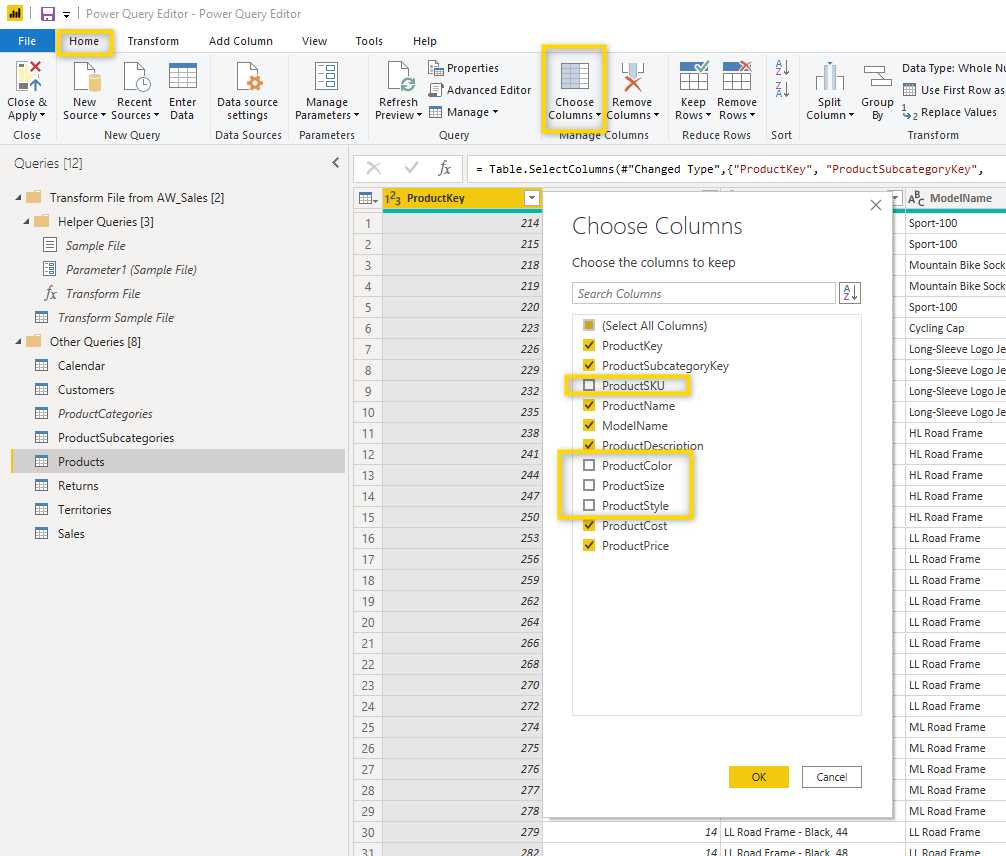
After you click OK, you only see the columns which were selected in the Choose Columns window. The nice thing about this function is that you can simply change which columns you want to see by clicking on the gear icon of the specific step in the list of applied steps.
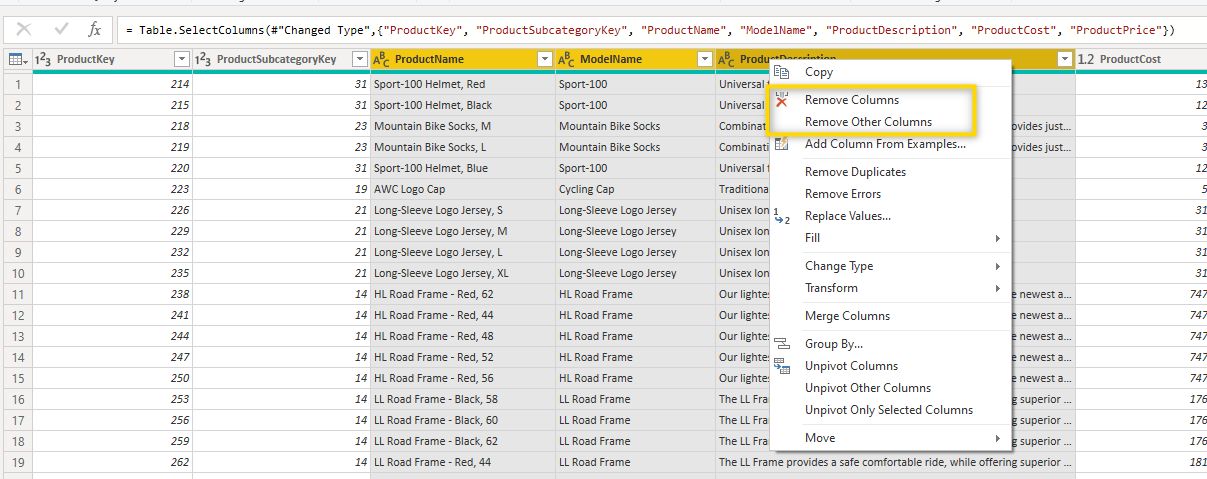
A different way of removing columns is to simply select the column header (or hold down Ctrl on your keyboard to select multiple columns), then right-click and either select Remove or Remove Other Columns. When you select Remove, the selected columns are removed and when you select Remove Other Columns, all columns which are not selected, are removed.
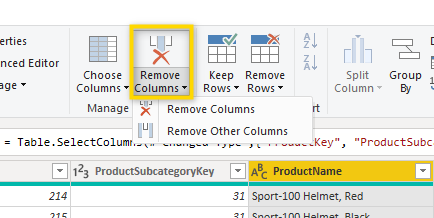
The exact same functionality is also available on the Home menu.
So as you can see, as always, there are different ways to get things done in Power Query Editor. The important thing is that no matter which option you chose, all steps can always be undone so don’t worry about removing too many columns.
Split
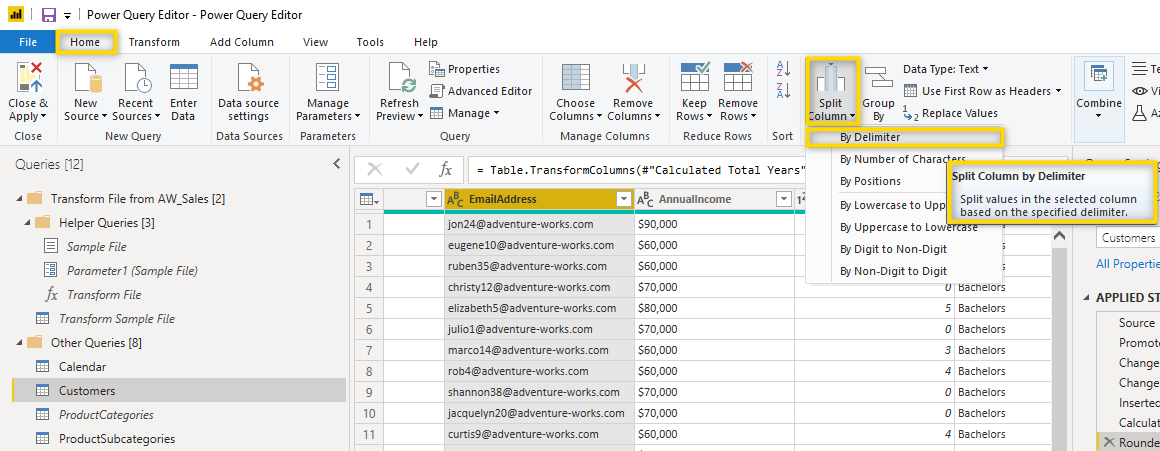
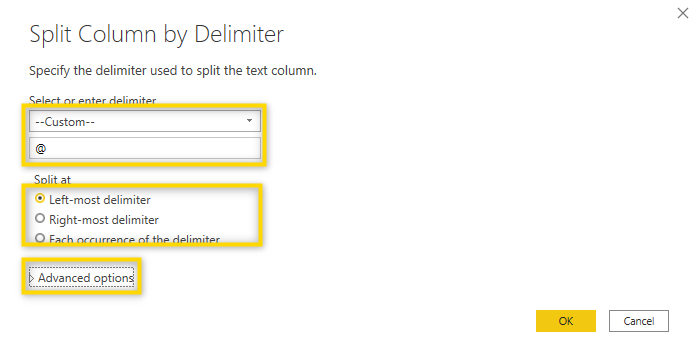
Sometimes you might want to split a column. This can be done with the Split Column function which lets you define the rules of the column split. Let’s assume you have a column showing an email address and you want to split it into 2 separate columns. The first column should show what’s before the @ symbol, and the second column should show what’s after the @ symbol. You can do this by selecting the column and select the Split Column. You then need to define the rule of the split. Because we want to split by a specific symbol we select by Delimiter. There are more split options and you can hover over them to see what they mean.
Once Delimiter is selected, you need to define a few more details. You can select one of the predefined delimiters or you can define a custom delimiter as we did here as we want to split the text where the @ symbol is. You also need to define where you want to split. Because an email address can only contain one @ symbol, it doesn’t matter which option we pick but depending on what you want to split, you might need to change this setting and maybe even open up the Advanced options. There are a lot of possibilities for splitting columns. this article just covers one simple case but hopefully, with this knowledge, you can find the solutions for your specific case.
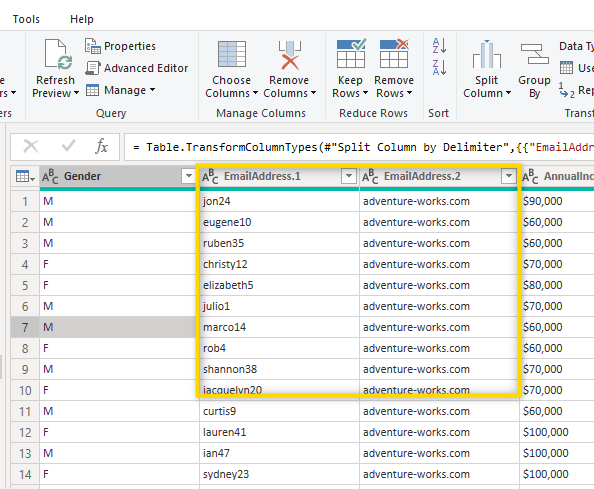
After you click OK, the column will be split. Now you just need to rename the column name and you’re done.
Add Column
In this part of the article, we’ll look at how additional columns can be added to a table. When you are in the Add Column menu, you can see that there are different ways to add a new column. Below we’ll cover the most common ones
1. Column From Examples
This function can be used in many different scenarios. Basically, you define what should be shown in the new column for one of the rows, and Power Query Editor will automatically create the values for the rest of the rows. Depending on the complexity of the new column, you might have to enter a value for several rows and sometimes, Power Query doesn’t get it right at all and you need to go for a different way to add the column.
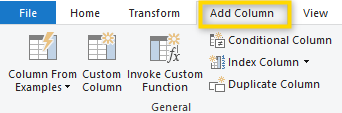
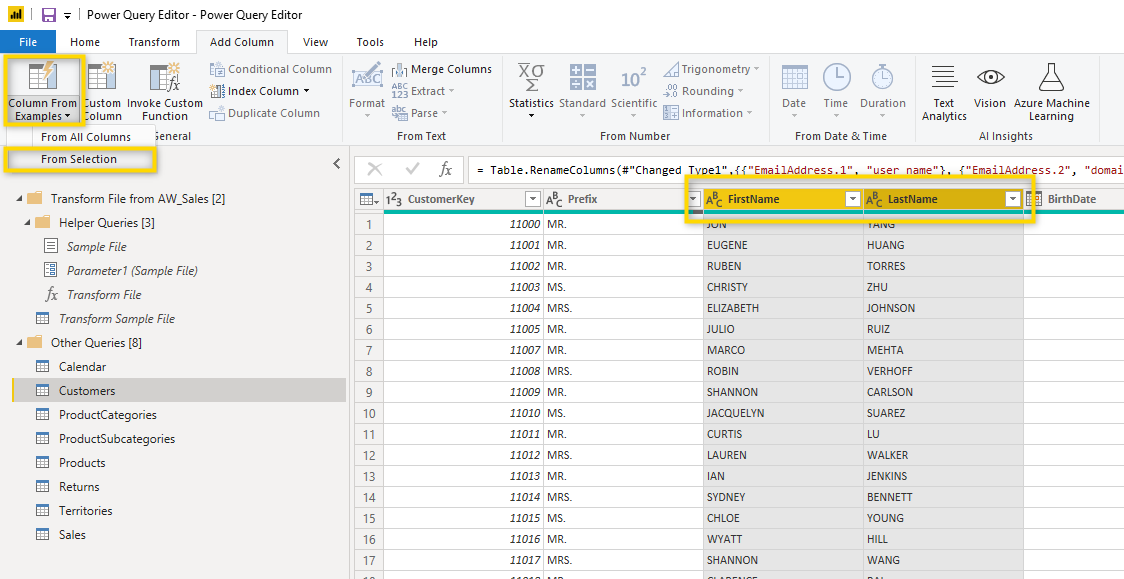
Let’s assume we want to add a Column that shows the full name. To do this, simply select the FirstName and LastName columns and then select Column From Examples > From Selection.
This adds a new empty column to the table in which you can add sample data. First, you should rename the column, then type in a sample in any of the rows.
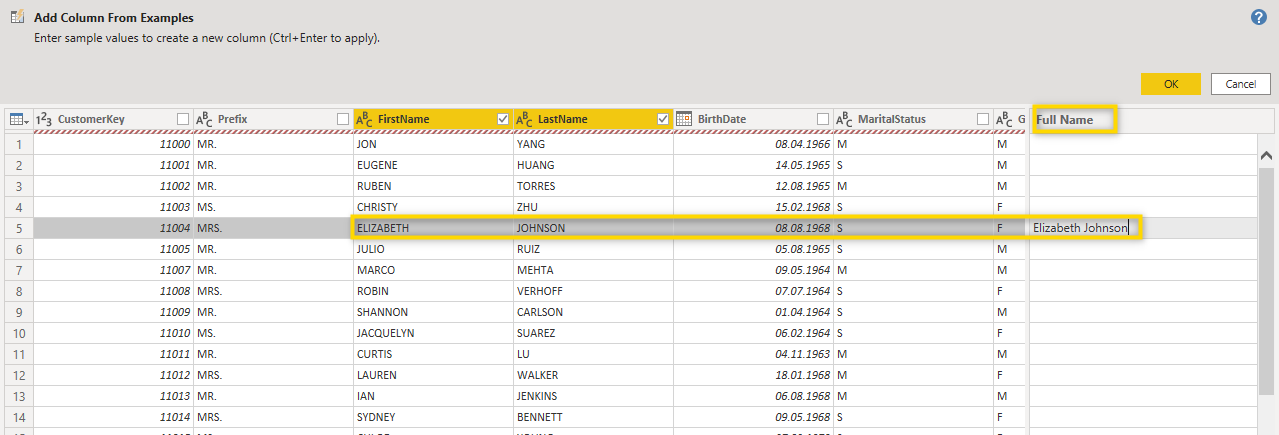
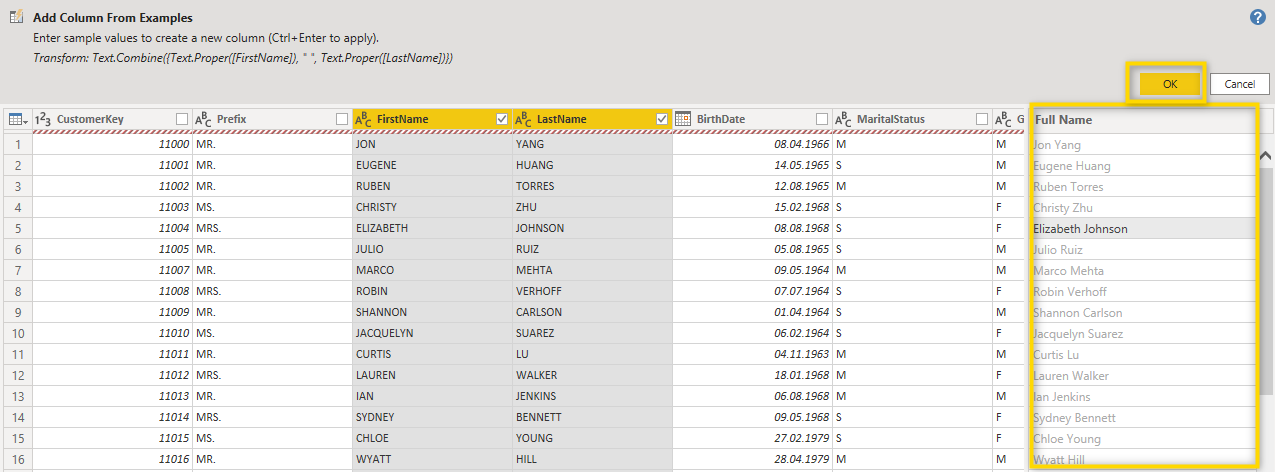
Power Query will then automatically try to figure out what you’d like to see in the new column and add the text or values to the other rows. If the values are correct, confirm with OK, otherwise, overwrite a value in one of the rows.
2. Custom Column
For more complex scenarios, you might need to add a Custom Column. When you select to add a Custom Column, you get the pop-up window shown below.
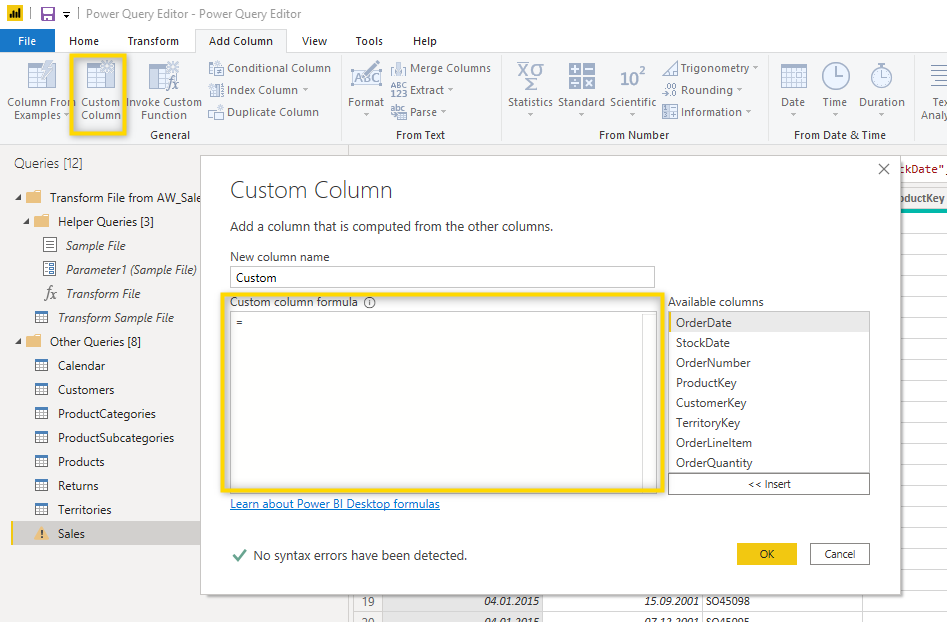
As you can see, this option requires you to add a formula. The formula language used in Power Query Editor is called M and is very powerful. But this also means that there are so many possibilities that we can’t go into details in this article because there are countless possibilities. We suggest you click on the link in the pop-up window to learn some of the basics directly from the Microsoft website. And as always, simply get in touch with us if you need help.
3. Conditional Column
Conditional Columns are great in many ways and are added very frequently in Power BI. Be aware that you could also add Conditional Columns directly in Power BI Desktop using DAX. To add a Conditional Column, select the table to which you’d like to add the column, and then select Conditional Column from the Add Column menu. In our sample, we will add a Column called age group to group our customers.
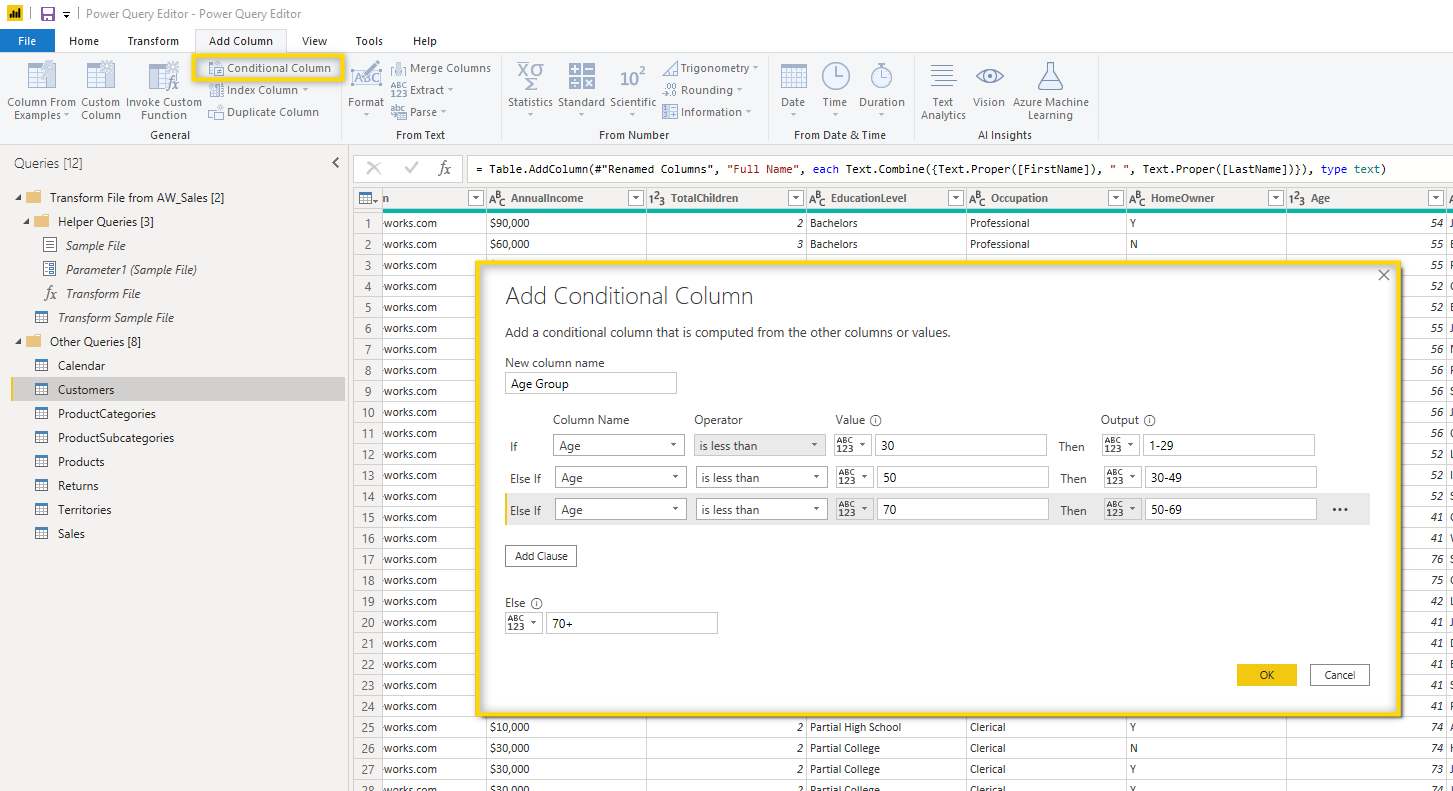
As you can see in the screenshot above, the basic setup is that you first give a name to the new column, then add the first If statement, followed by as many Else If statements as you need, and, in the end, have an Else statement to cover all the remaining possibilities. This Condition adds a column like this:
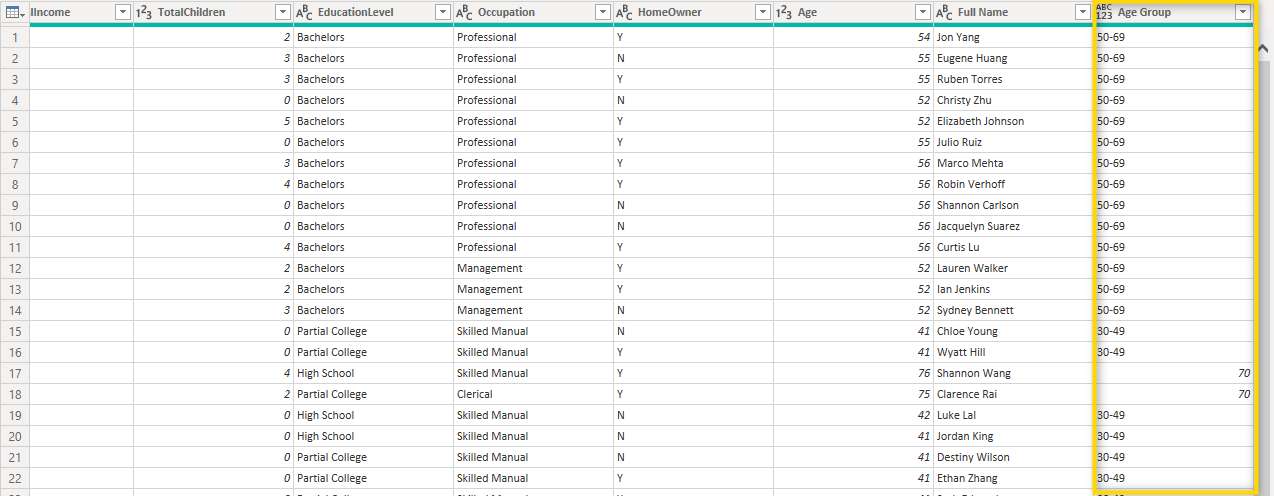
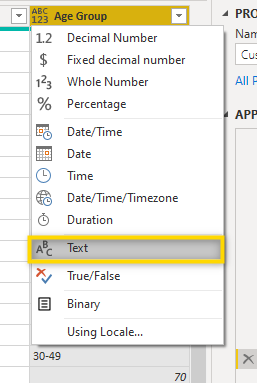
Because 30-49 is not a valid numeric value, you should change the data type of this column to text.
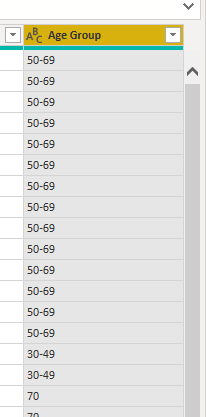
Now you have a new column showing the age group of your customers.
4. Index
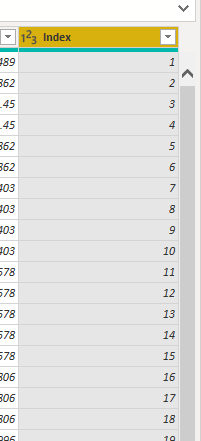
If you need a numeric column that simply shows the row number, you can use the Index Column function. In this function, you can define if the numbering should start at 0, 1, or at a custom-defined number. To add an index column starting with 1, just go to the Add Column Menu and select Index Column > From 1
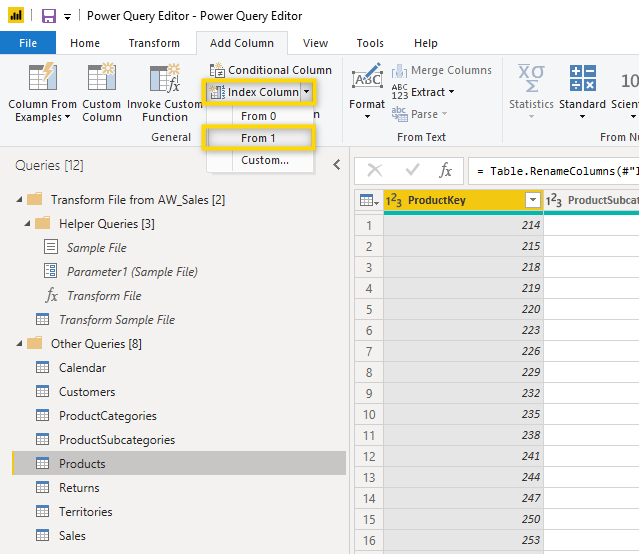
You now have a column showing the row number.
Replace
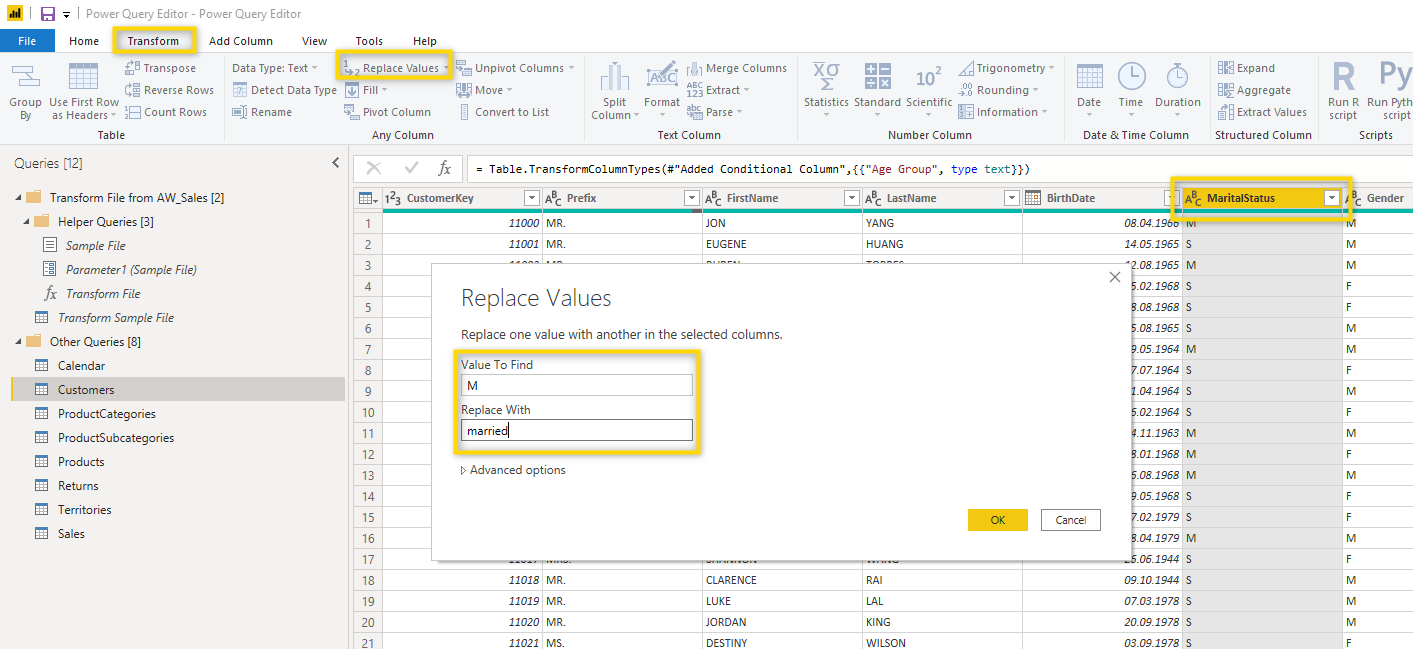
The data in the source from where you load might not always show exactly what you expect and you might want to replace some values. Let’s see how you can replace the values in the column MaritalStatus in the Customer table. Right now, there are 2 different values M or S but actually, we would like them to be married or single. To make this replacement, select the column and then click Replace Values in the Transform menu. In the Replace Values window, you can then define what should be replaced. In our case, we want to replace M with married. Confirm with OK.
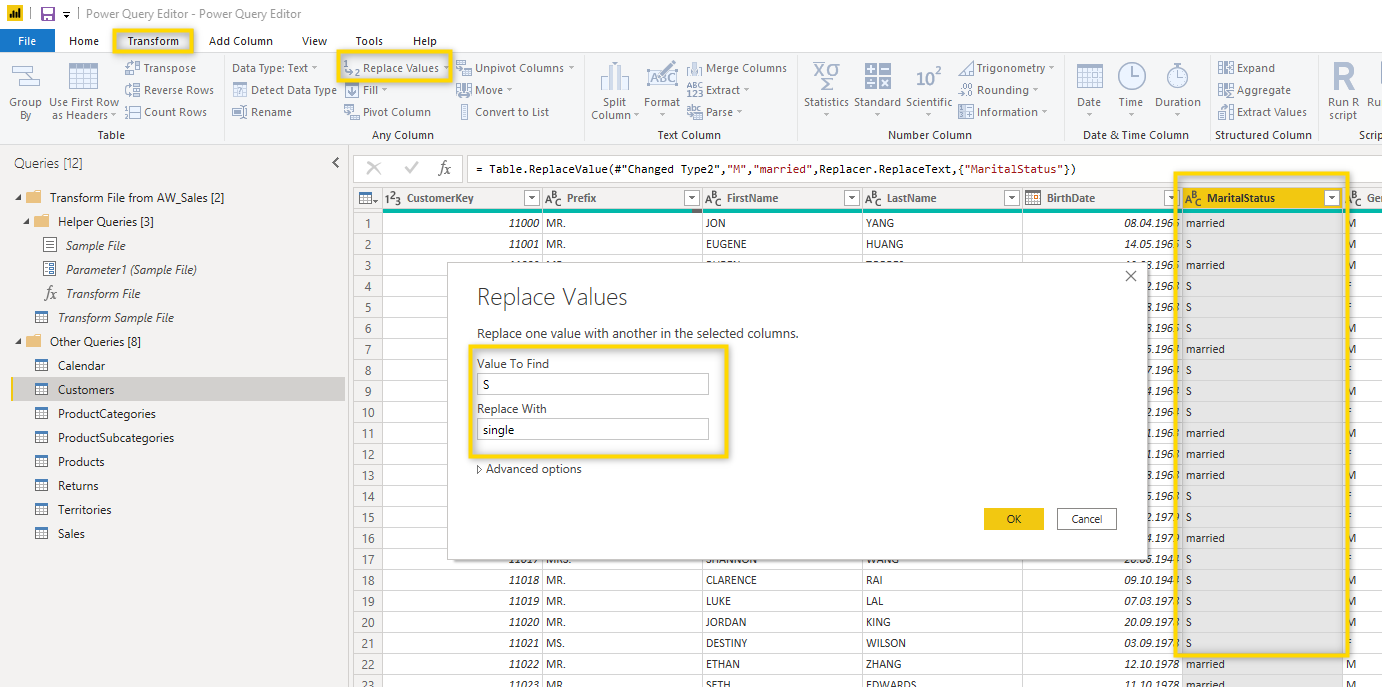
We now have replaced the M with married as you can see in the screenshot below and the only thing left to do is to replace the S with single.
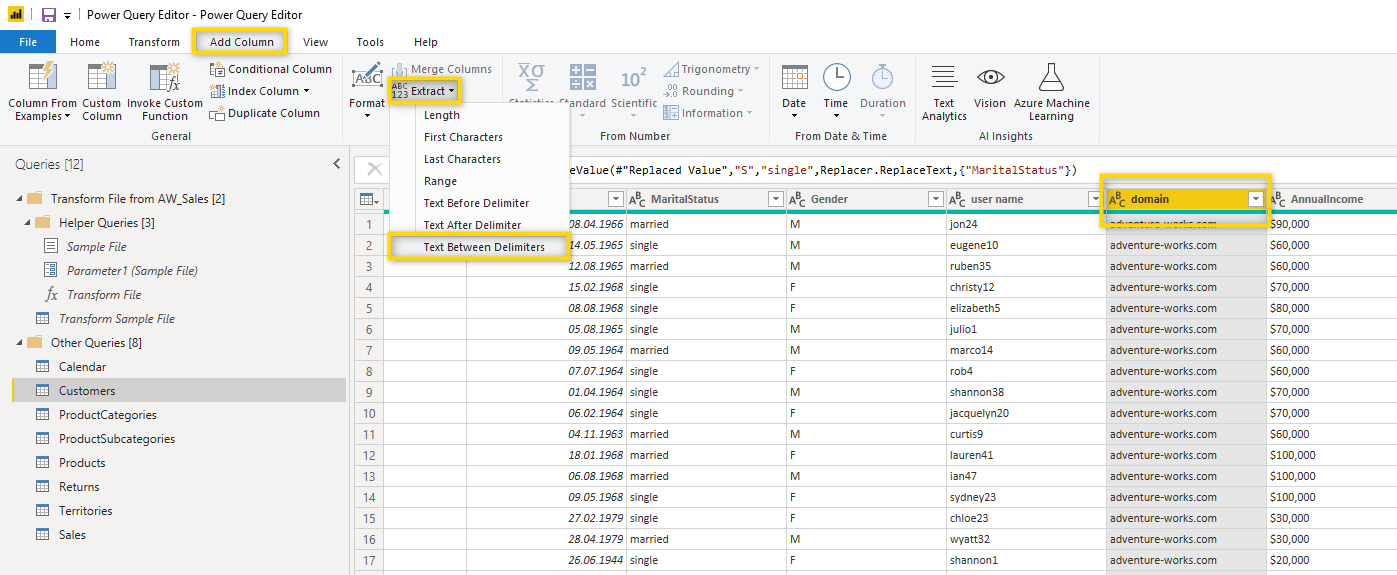
Extract
Using the Extract function helps you to extract a specific part of the content of a column. Note that the Extract function (like many other functions) is available in the Transform and in the Add Column menu. If you want to modify the existing column, use the Extract from the Transform menu and if you want to leave the existing column untouched and add an additional column with the extracted part, use the Extract function from the Add Column menu. These are the possibilities you have in the Extract menu.
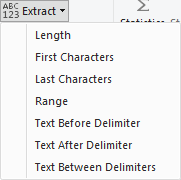
Length: This returns the length of the text in the selected column
Frist Characters: This lets you define how many characters (from the left) you want to extract
Last Characters: This lets you define how many characters (from the right) you want to extract
Range: This lets you define a starting point in the text and how many characters you want to extract from this starting point
Text Before Delimiter: This lets you extract the text before a delimiter
Text After Delimiter: This lets you extract the text after a delimiter
Text Between Delimiters: This lets you extract the text between 2 or more delimiters
Let’s say that we want to add a new column that extracts the text which is between the – and the . of the domain column in the Customer table. To do this you need to select the domain column, go to the Add Column menu and select Extract > Text Between Delimiters.
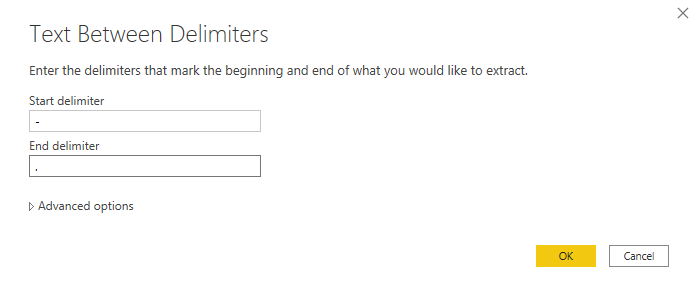
You then need to define the starting and ending delimiters. In our case these are – and.
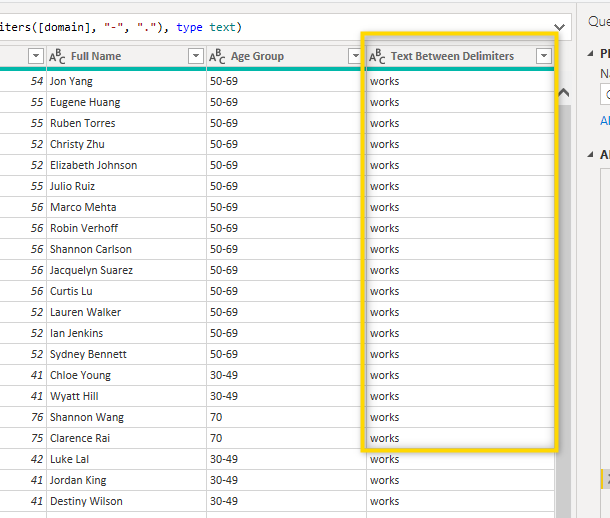
After confirming with OK, a new column is added, showing only the text between – and.
In our sample data, this means that this column shows the word works in all the rows
Date Time
1. Date Format
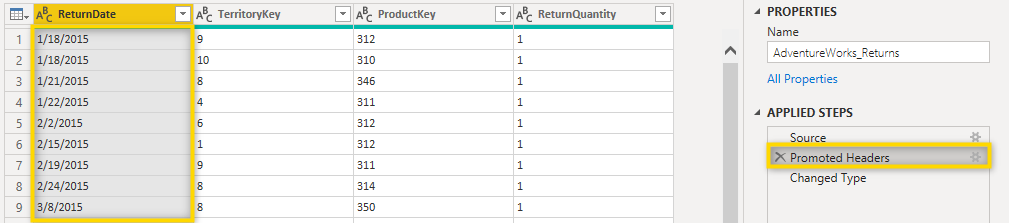
Since there are different date formats around the world, Power BI doesn’t always detect a date column when the format in the source is different from your Power BI settings. Let’s look at a specific case. In Switzerland, the data format for the 18th of January 2015 is 18.01.2015 while in the US, this would be 1/18/2015.
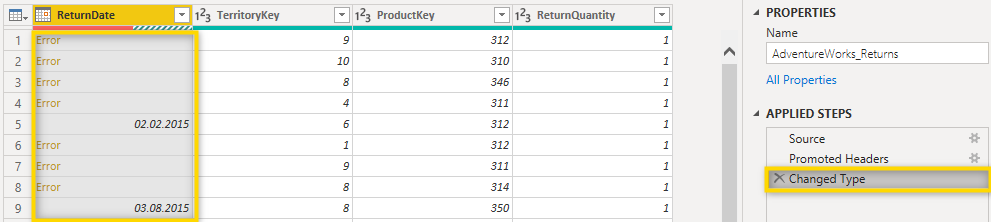
In this example, Power BI is set to use the date format of Switzerland but the dates that were imported are in US format. In the picture below, you can see the format of the date as it is in the source. Note that the ReturnData column is still defined as text and not as a date.
When we now apply the step Changed Type and change the type of the ReturnDate column to date, you can see that we get errors. For some of the dates, it worked fine, for others it didn’t. The reason is that the date setting for Switzerland expects to have the day first and then the month so of course, translating numbers bigger than 12 into a month doesn’t work and returns an error.
How can this be solved?
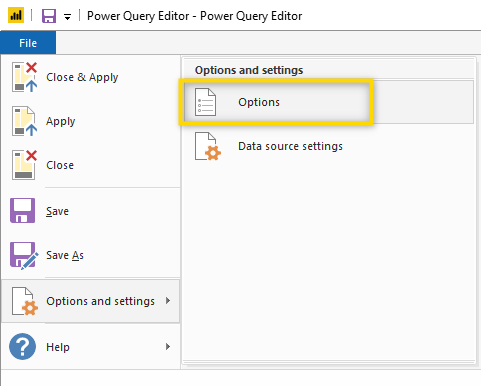
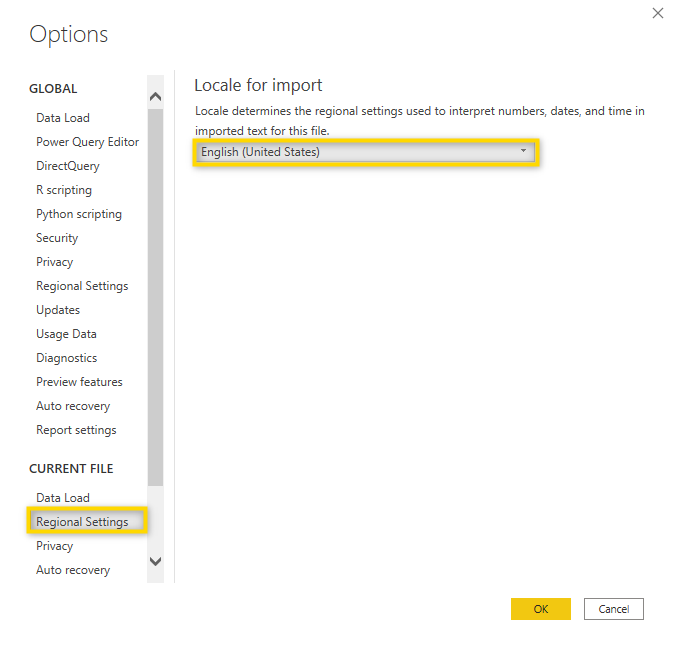
If you know beforehand that your source system has a specific date format, you can change the setting of the Power BI file to match his format. To do this, go to File >Options and settings > Options and change the regional setting of the current file to the format of the source system.
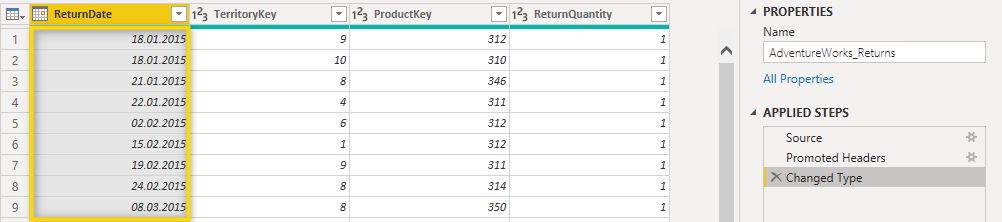
Once you did this, the table doesn’t return any errors anymore. You might have to refresh the data or select a different table for the view to update.
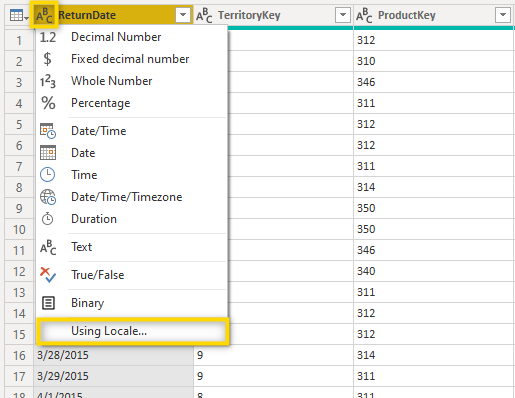
The approach above might not always be feasible. For example, when you have multiple data sources with different formatting settings. In this case, you can also leave the overall file settings as they are and change the format for each of the columns. To do this, select ABC in the header of the column and then Using Locale.
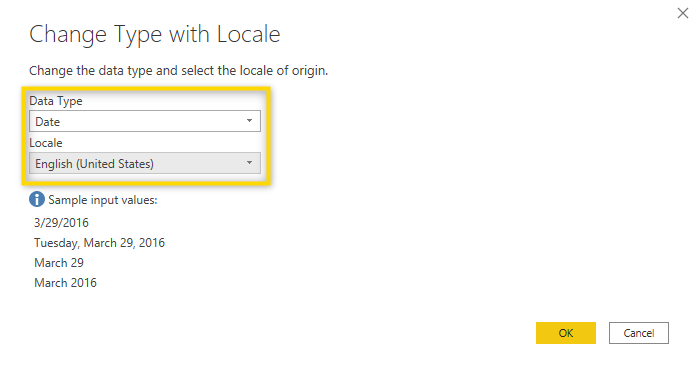
You can then select the data type and locale setting.
After you click OK, the column should not return any errors anymore.
2. Add additional columns based on the date column
If you have a data column but would also like to have a column showing only the year, month, quarter, week, weekday, etc., there are specific functions integrated into Power Query Editor which help you do that. Find out how to add additional columns based on date.
3. Calculate the age
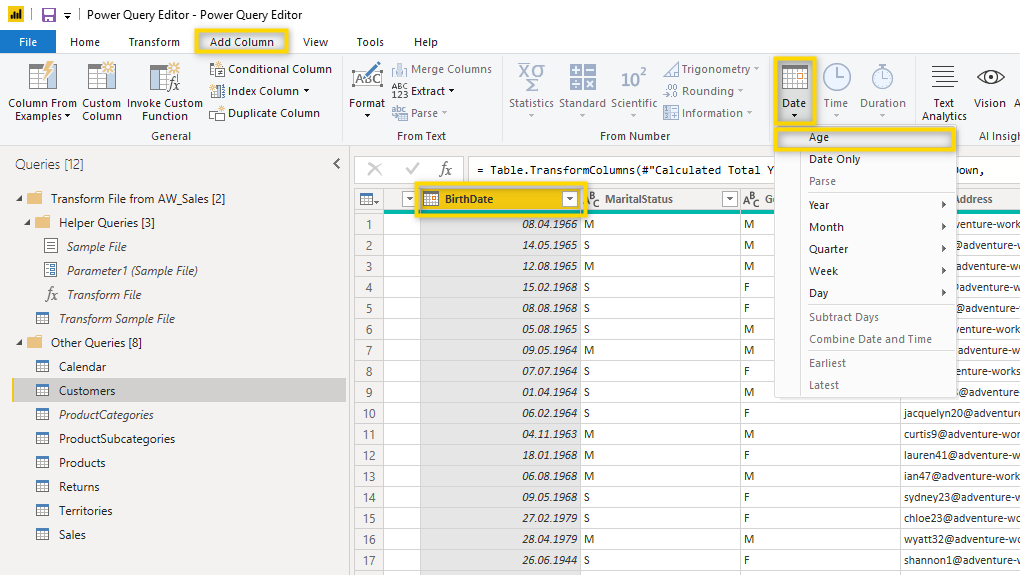
If you want to calculate the difference between a date in your data model and the current date, you can use the age function. In the following example, we’ll calculate the age of a customer based on the column BirthDate. In our case we want to add an additional column with the age, this is why we do this transformation in the Add Column menu. If you want to replace the date column with the age column, you can do the same transformation in the transform menu. Select the date column and then select Date > Age
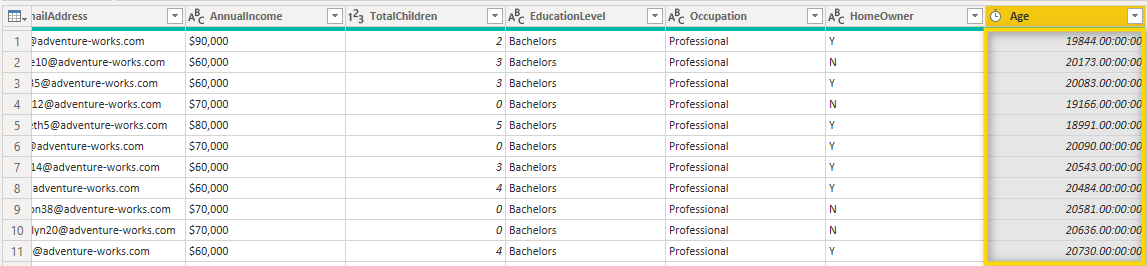
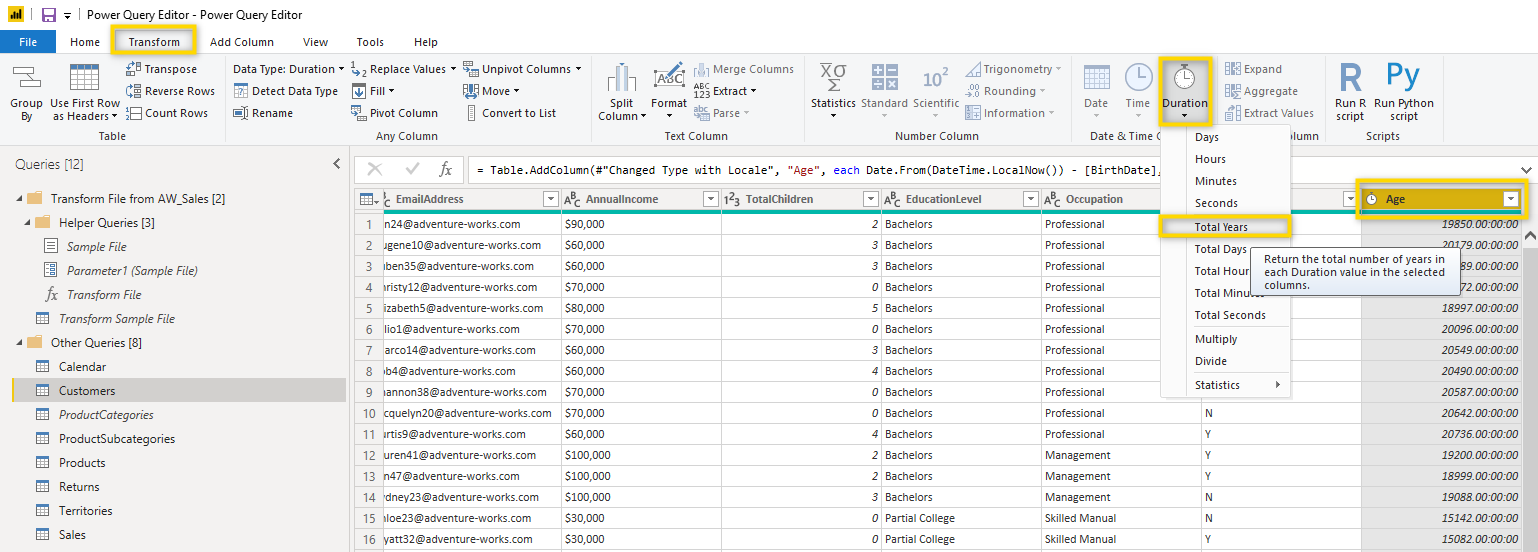
Once the age column has been created, you will notice that the formatting isn’t what you expected. This is due to the fact that the age calculation returns a number in days, hours, minutes, and seconds. So you still need to change the format of the column to show years.
To change the format to years, go to the transform tab, select the Age column, and then Duration > Total Years.
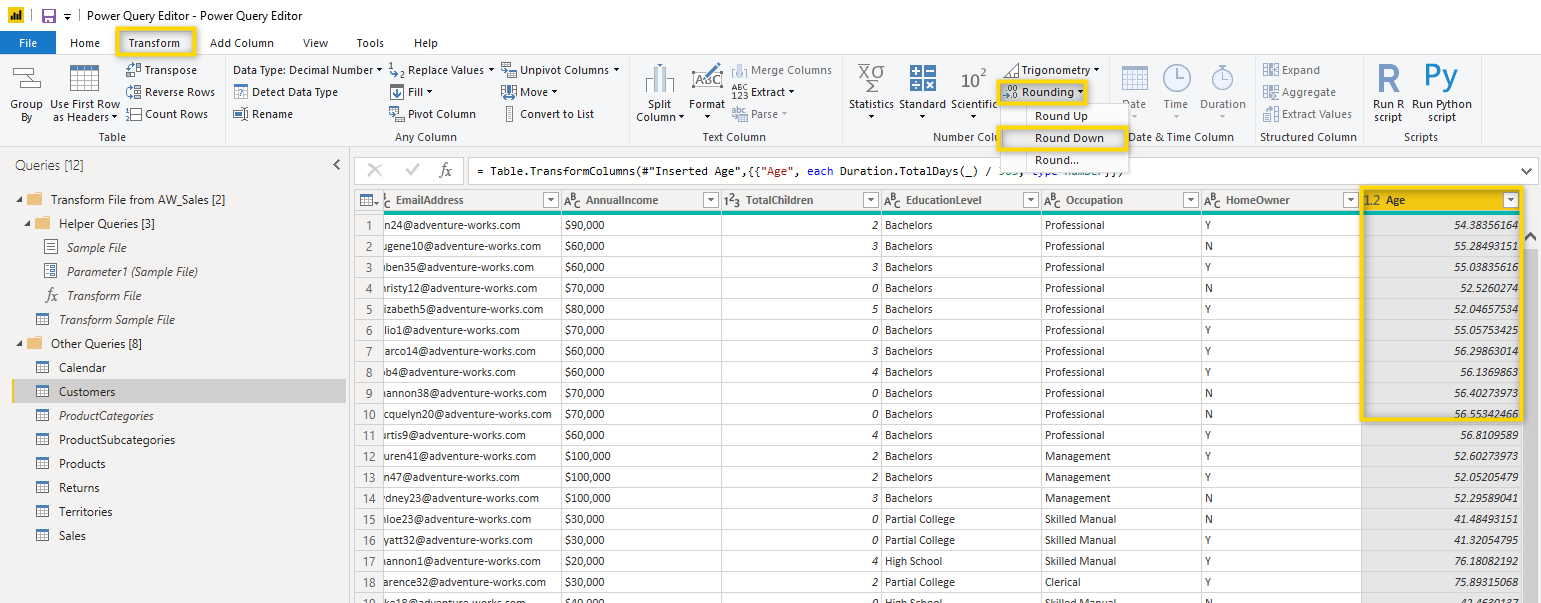
After this change, the numbers are shown in years but you might want to add some rounding depending on what age you calculate. If you calculate the age of a person, you would probably round down to only show full years. To do this, select the Age column and click Rounding > Round Down.
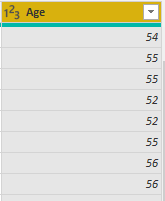
The age column now only shows years.
There are a few things that you need to consider when doing the age calculation like this:
- The Age column is only updated when you refresh the report;
- Leap years are not considered. If you need to have leap years considered as well, you could use a custom function to do that;
- You could also do the same calculation using DAX in Power BI.
Statistic
Sometimes you might want to quickly see some statistics about the data in Power Query Editor. Maybe you want to see the number of rows, the distinct count of elements, the Average of a values column, or some other interesting information. In case you need this information in the report, creating DAX functions would be the right approach. But sometimes you just need to see some statistics of your data directly in Power Query Editor. This is how you can do that:
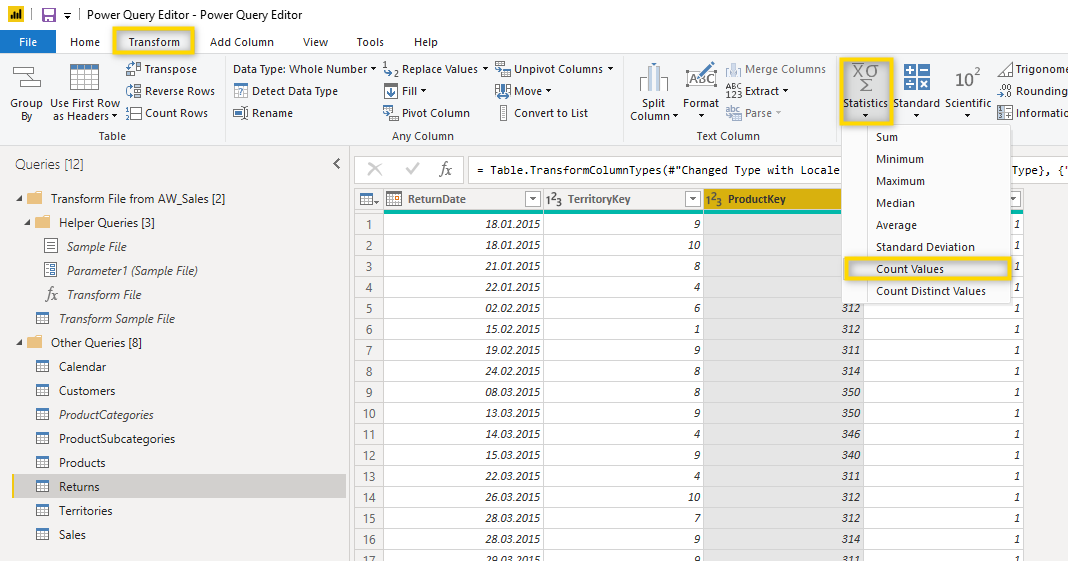
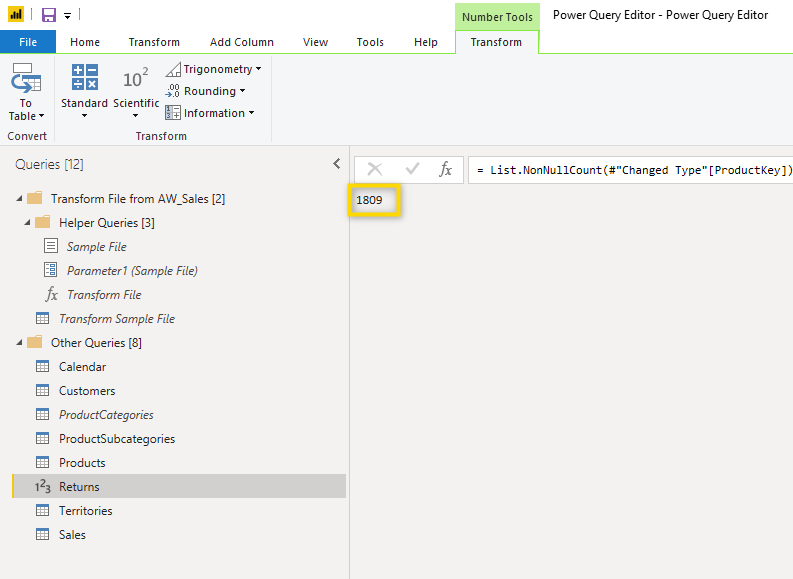
So you want to see how many rows you have in a specific table. Simply select any of the columns and in the Transform tab, select Statistic > Count Values.
This simply returns the number of rows in this table.
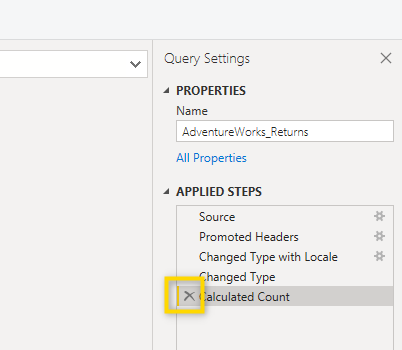
To go back to see the entire table, you have to remove the specific step from the list of applied steps.
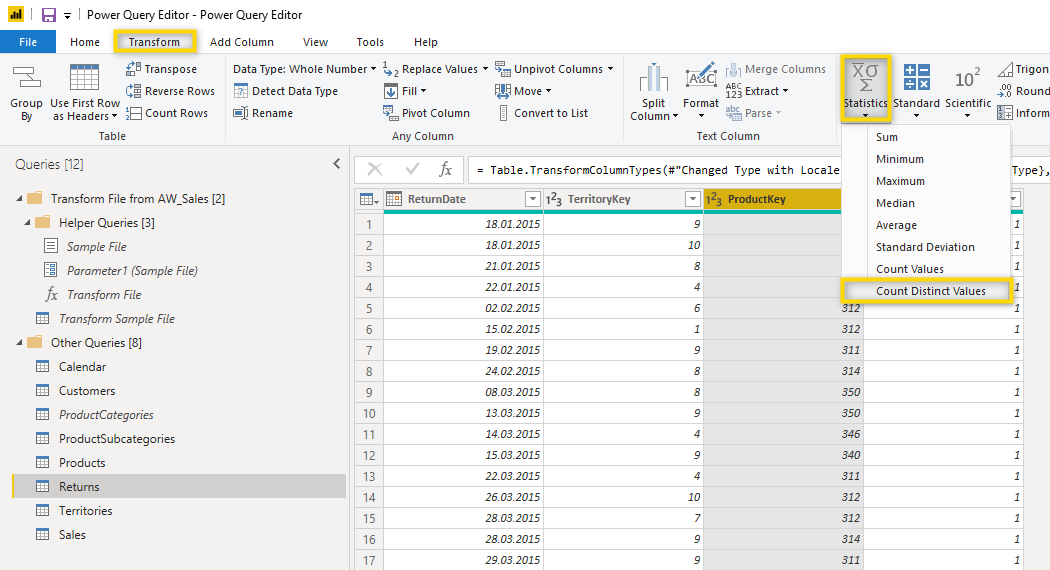
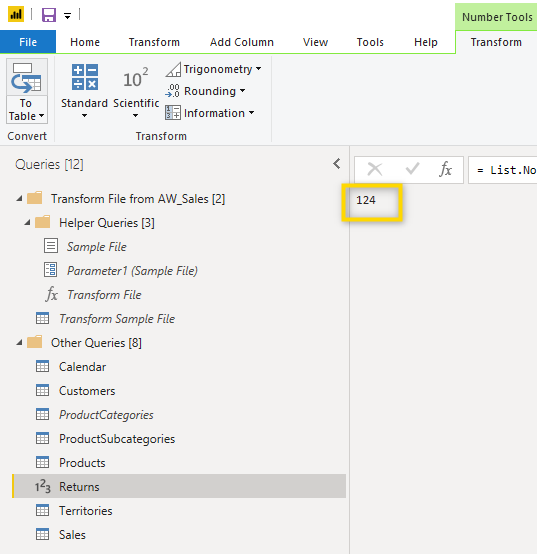
Now let’s see how many products have been returned. To do this, you can use Statistic > Count Distinct Values.
This returns a single value.
These are just a few examples of what you can do with the statistics functions. Most of them should be more or less self-explanatory so hopefully, you will figure out how to get the information you want.
Calculations
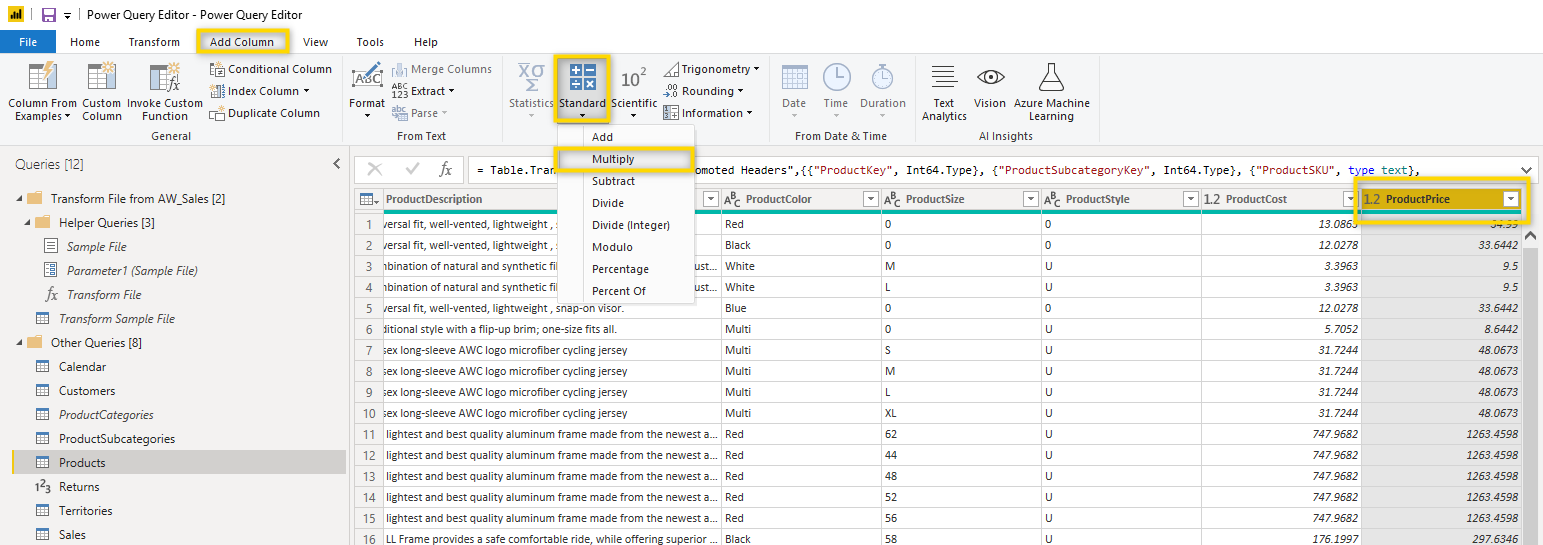
In Power Query Editor you can also add columns that make a calculation based on an existing column of the data. Please note that this can also be done using DAX directly in Power BI. Let’s assume that you have a column that indicated the price of a product but now you’d like to add an additional column that adds 10% to this price. To do this, select the column with the price, go to the Add Column tab and select Standard > Multiply.
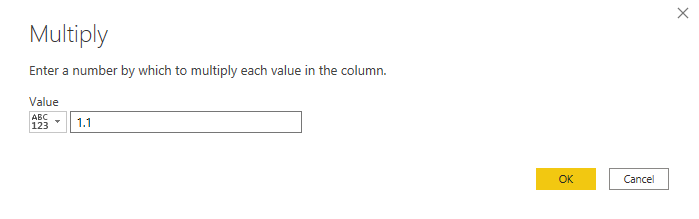
Now you need to define the multiplication factor. We want to add 10% so we have to enter 1.1.
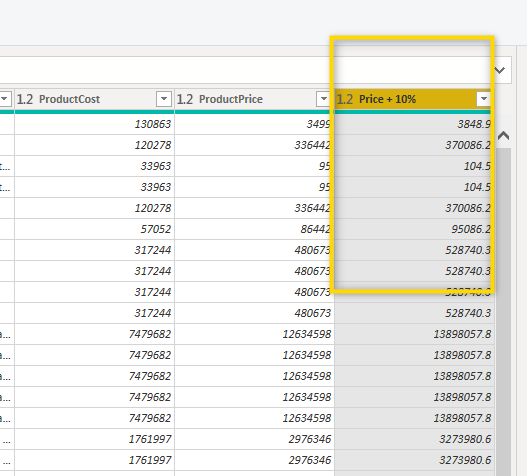
After you confirm you get an additional column with the updated price. Now just rename the new column and you’re good to go.
Merge
The merge function is used to add additional columns to a table by using a join from another table. There are different joins that can be used but we will focus on the most common one in this article. If you need more information about how joins work, there are a lot of helpful resources that can be found online. Always before you do a join, remember that tables with too many columns might slow down the report. More about this is described in the article about the star schema.
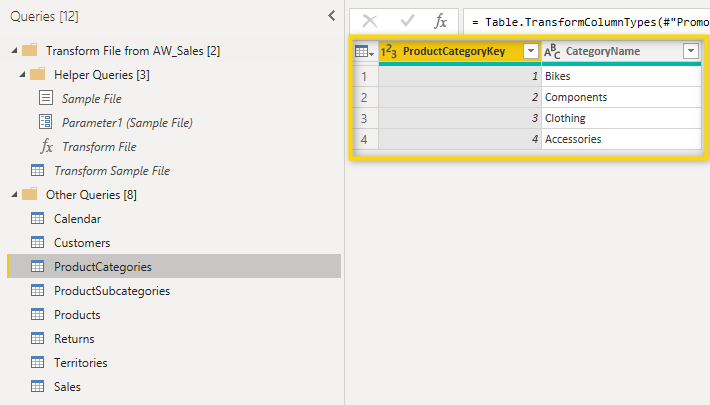
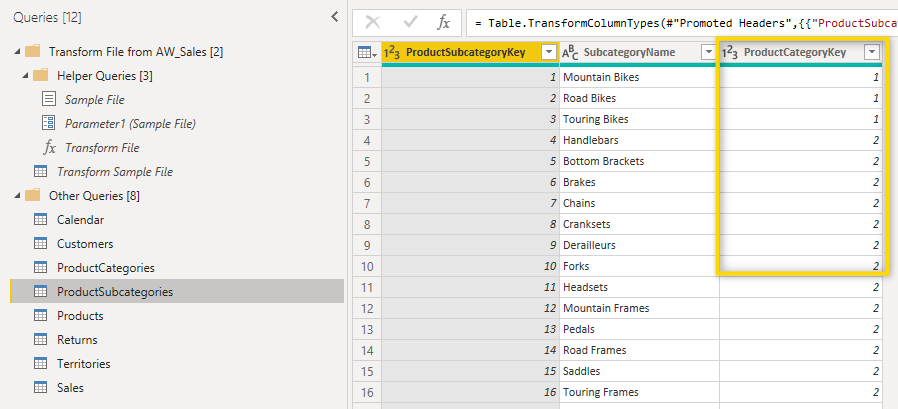
Let’s make a simple sample. For whatever reason, we want to get rid of the ProductCategories table but since this is the only place where we have the Category name, we first need to merge this data into the ProductSubcategory table. We can do this using the common column ProductCategoryKey as shown below.
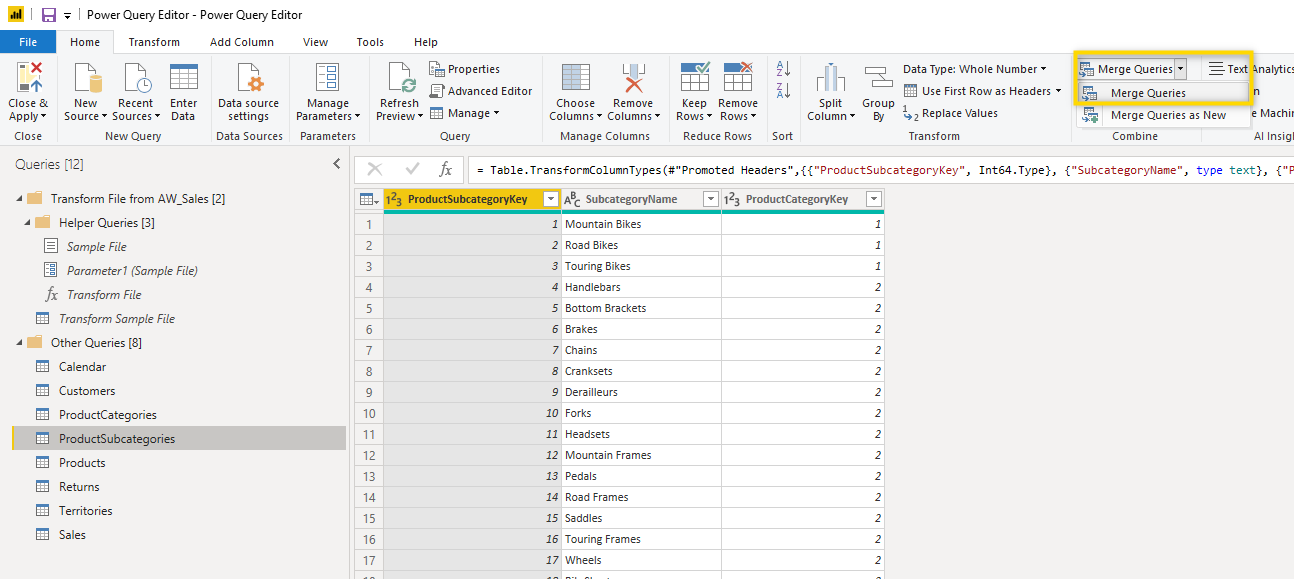
To start the merge, select the table to which you want to add the column. In this case, this would be the ProductSubcategories table. Now, select Merge Queries and then define whether you want to merge into the existing table or add a completely new query. We don’t need to add a new table so we just use Merge Queries.
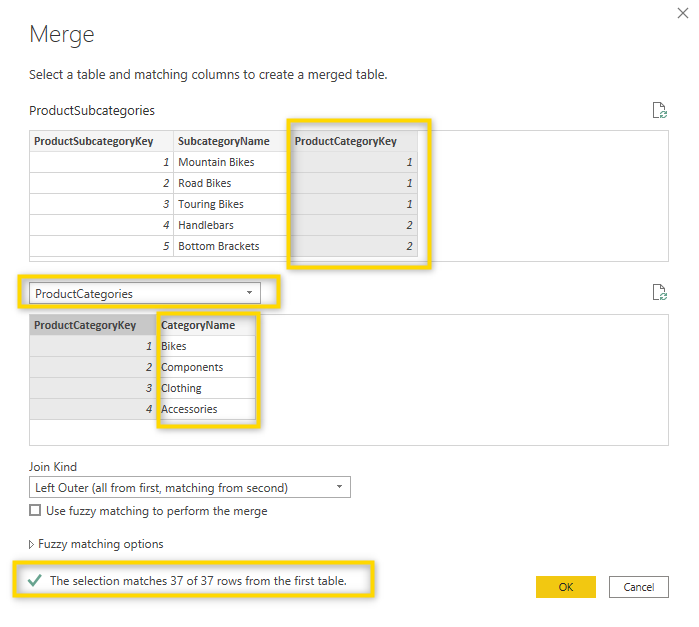
In the Merge window, you now have to define which columns from which tables are used for the merge. So select the ProductCategories table and select the ProductCategoryKey column from both tables. As mentioned before there are many join options but we use the preselected Left Outer join which results in a perfect match for all rows as indicated with the green tick mark at the bottom. Confirm with OK and the merge is executed.
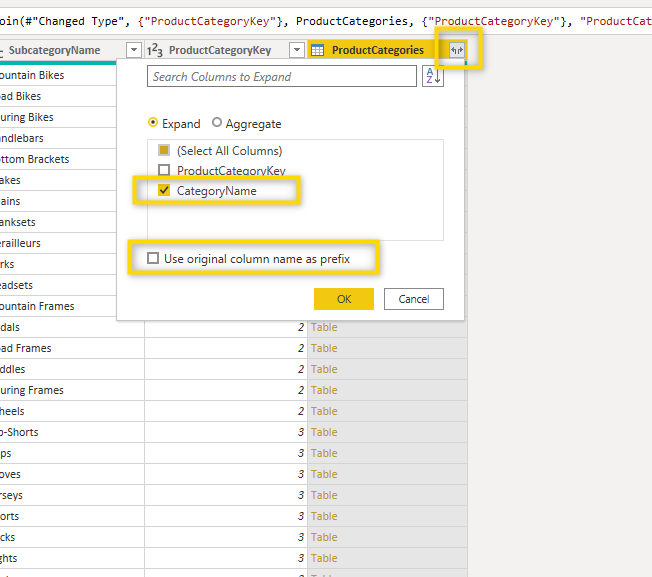
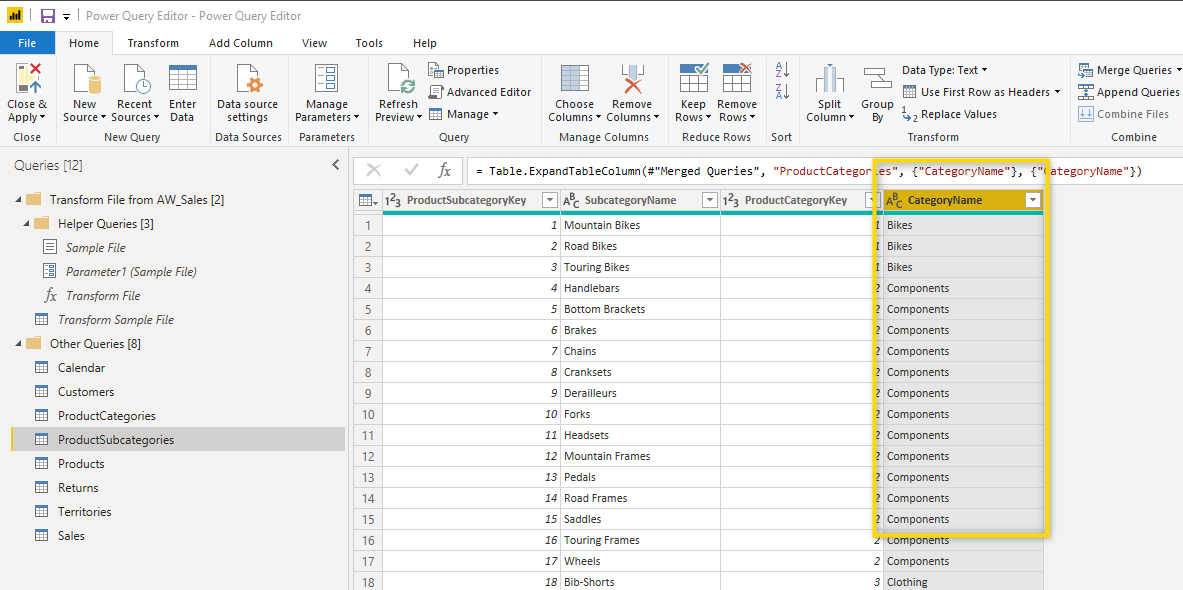
Now you need to define which of the columns should be shown, to do this select the icon on the right-hand side of the column header of the newly added column. Because we already have the ProductCategorykey column in the table, we only want to add CategoryName. Also, the Use the original column name as a prefix can be unchecked as this would result in a long name and we don’t want that.
Once you hit OK, you have an additional column showing the CategoryName for each row.
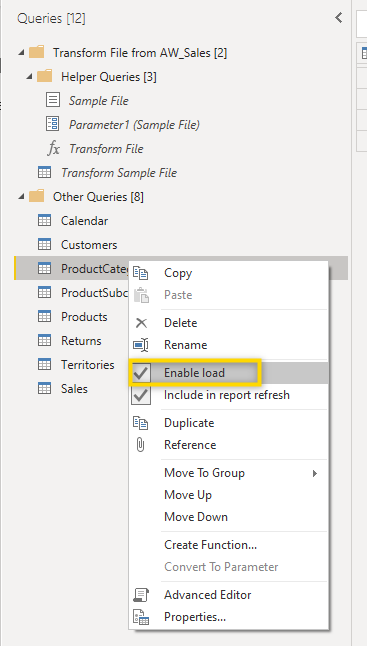
Because we now have all the needed information about the Product Category in this ProductSubcategory table, there’s no longer a need to load the ProductCategory table to the data model so we should disable the load with a right-click on the table and undeck Enable Load.
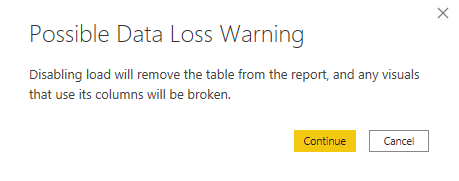
In case this table has been loaded to the data model before, there will be a warning. If you haven’t used this table in any visual or measure, there’s nothing to worry about. If you have used this data in the report and disabled the load, you will have errors in the report and need to make adjustments to get it to work again.
Append
You can use the append query function to combine two or more tables that have the same structure (same columns) into one table. A common use case is that you have actuals and plan data in separate tables but want to combine them into just one table. Find an explanation of how to use the append function for this specific case.
As mentioned in the beginning, these are just some of the things you can do in Power Query Editor. There are many more advanced and more complex transformations you can do. In case you’d like to do a transformation that hasn’t been covered in this article, simply send us an email and we’ll try to help.