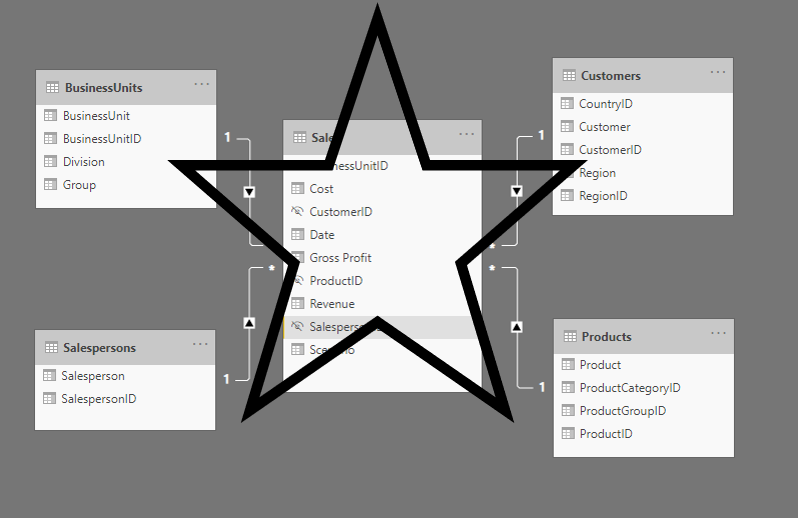
Most Power BI reports contain multiple tables. These tables need to be linked together to create a proper data model. Whenever possible, this should be done using the star schema.
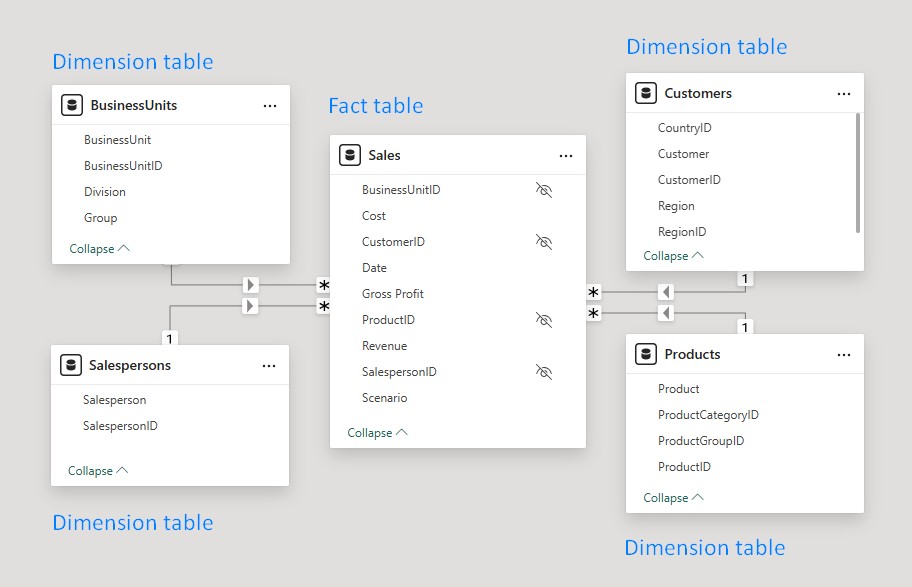
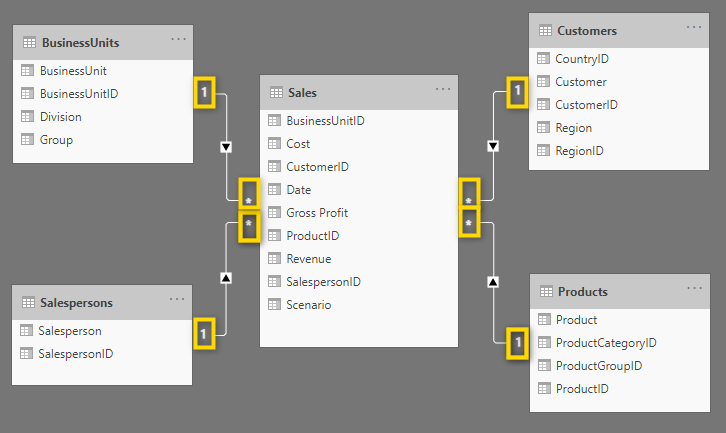
To insure you use all the benefits we can offer you with this example, feel free to start your free trial of Zebra BI for Power BI. First, let’s see what a data model according to the star schema looks like. As you can see in the picture below, this data model contains one fact table and four dimension tables which are all linked to the fact table. It doesn’t matter how many dimension tables you have, the star schema is considered best practice and in the following article, you’ll learn what you have to look out for.
What is a dimension table?
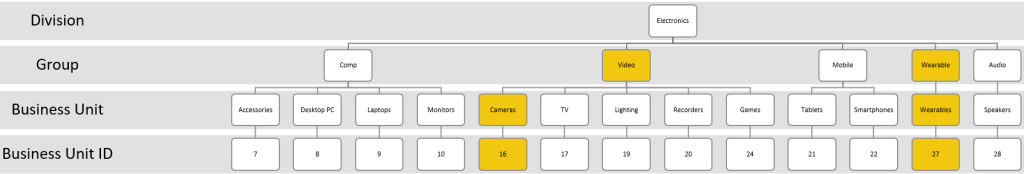
Let’s take a closer look at the BusinessUnits table from our data model:
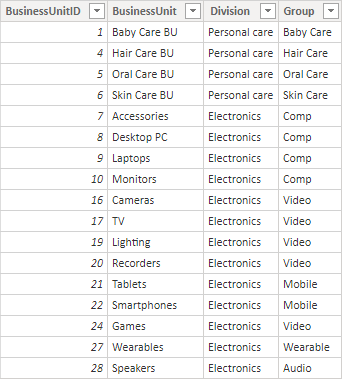
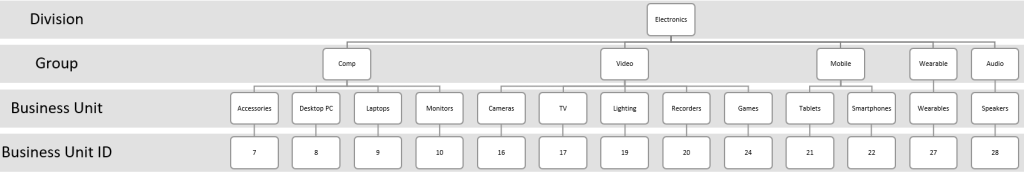
As you can see, every BusinessUnit has one unique BusinessUnitID and belongs to one Group. Each Group is allocated to a Division. When only looking at the Electronics Division, this is the organizational structure this table represents.
So what is this dimension table used for? Basically, it is used to filter the data from the fact table according to different organizational views. With this table, you can show data for Business Unit, Group, or Division level. This is possible because, in the data model, there’s a link between the BusinessUnitID in the BusinessUnits dimension table and the BusinessUnitID in the Sales fact table.
So each row in the Sales fact table contains a BusinessUnitID and since we have linked BusinessUnitID between the tables, filtering is possible. Some more information about filtering will come later in this article.
What kind of fields are included in a dimension table?
A dimension table contains a field with a unique ID. In our example, this would be the BusinessUnitID. On top of that, dimension tables can contain other descriptive fields such as the description belonging to the ID (BusinessUnit) and the groups the unique ID belongs to. Other fields that could be added to this example are the name of the person that is responsible for the BussinessUnit, the location of the head office per Group, or something similar. But you would never include the number of sales or other transactions in the dimension table.
What is a fact table?
This is what our fact table looks like:
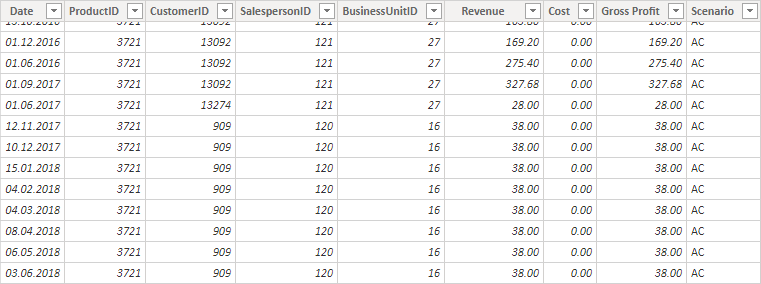
This table shows individual sales transactions (facts). Of course, you can have multiple transactions on the same day, for the same ProductID, CustomerID, etc. This is why fact tables are usually longer (contain more rows) than dimension tables.
⚠️ Power BI can deal with very long tables but might slow down when you have tables with a lot of columns. So it’s best to have narrow tables. That’s also a reason why you want to create a star schema and not just have one single table with all the information.
You can also see that the table contains values for Revenue, Cost, and Gross Profit. These are facts that are normally aggregated and filtered according to a field from a dimension table.
Let’s assume you want to see all transactions belonging to the Group Video from the BusinessUnit table and you only have the transactions shown above where you only have BusinessUnitID 27 and 16. By filtering on Video, you would only see the transactions from BusinessUnitID 16 but not the ones from 27.
What kind of fields are included in a fact table?
The fact table includes facts or transactions but even more importantly it also contains a key to each of the dimension tables in order to create the relationship between the tables and be able to slice and dice the data using the fields from the dimension tables.
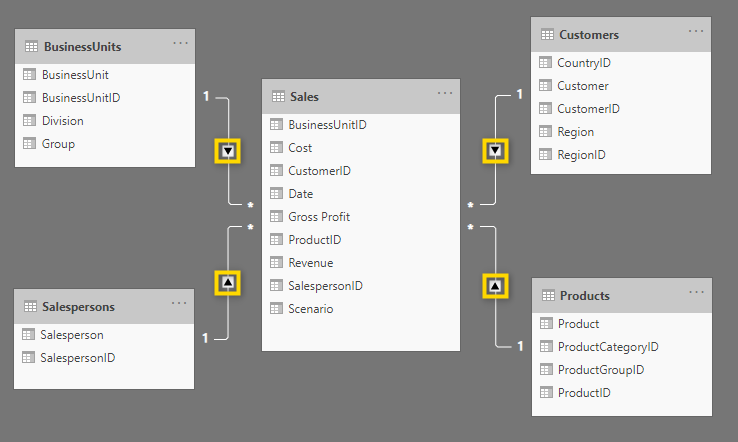
Relationship between the fact table and dimension tables
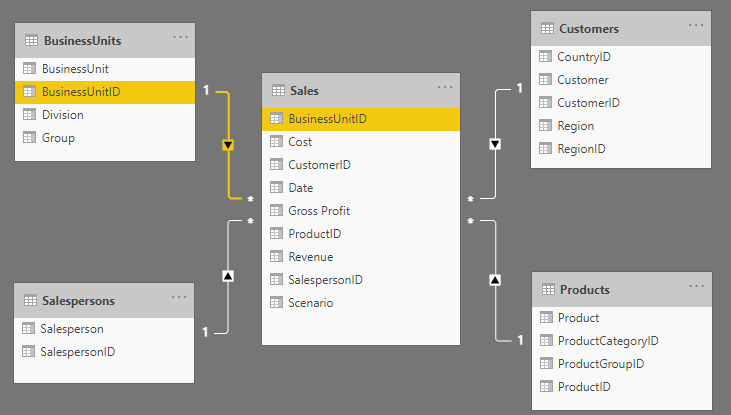
As you can see, every dimension table’s unique ID is linked to the fact table.
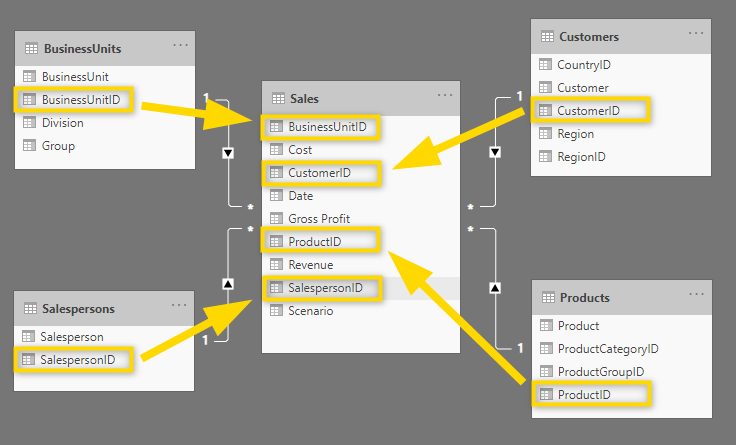
All these relationships are many-to-one relationships which are indicated by the * ( many) on the side of the fact table and the 1 on the side of the dimension table. This means that there can be multiple sales for the same BusinessUnit, but the details belonging to the BusinessUnit are unique.
Also, note that the filters are always pointing away from the dimension table and towards the fact table.
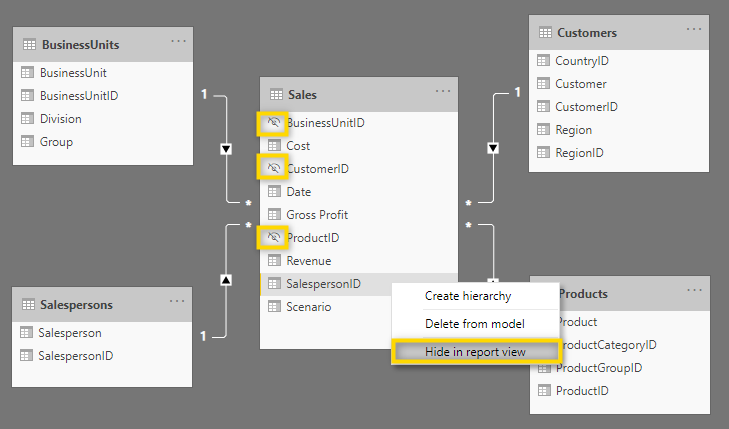
To avoid using a filtering dimension from the fact table, it’s considered best practice to hide them in the report view.
If you can follow all these rules, you have a perfect star schema.
Sooner or later you might face a situation where a perfect star schema isn’t possible anymore due to the high complexity of the data in your report. This is also fine, however, you should always try to be as close to the star schema as possible.
Please read our guide to find out more about about star schema and performance optimization of your Power BI reports. You are also welcome to try it in the 30 day free trial of Zebra BI for Power BI.