The drill through function in Power BI lets you select a value in a visual and drill through to a different page showing the details for the value you have selected. It’s a fantastic way to navigate in a report because you can jump to a page containing what interests you, in just a few clicks. There are so many possibilities and cases when it comes to drill-through functionality.
Watch how to create drill through in Power BI in just a few steps.
To illustrate what the drill through function can actually do, we’ll first look at the Zebra BI Sales dashboard where drill through has already been integrated.
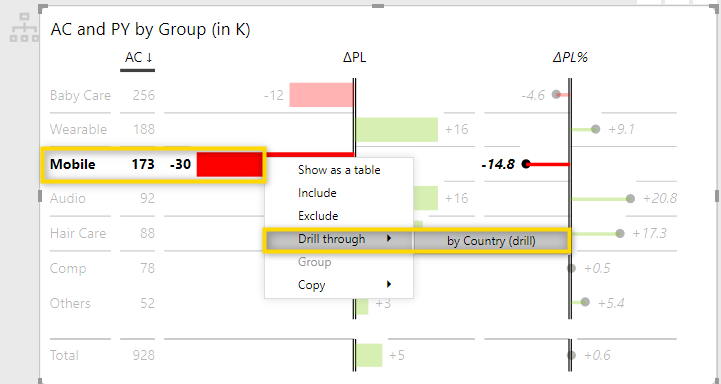
On the landing page of the Zebra BI Sales dashboard, we can see that the Mobile sales are below budget. So, naturally, we want to know why. There are actually two ways to navigate from the main page to the drill through the page.
You can right-click the category Mobile and then select Drill through and the desired drill through the page which, in this case, is called by Country (drill). This option is always available as soon as a drill-through page has been defined.
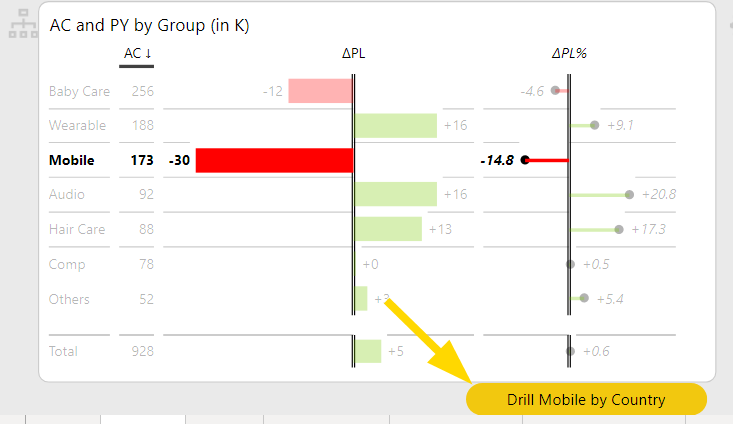
Or you can even click on the button below the visual. Note that the button needs to be added manually, but we’ll show you how further down in this article.
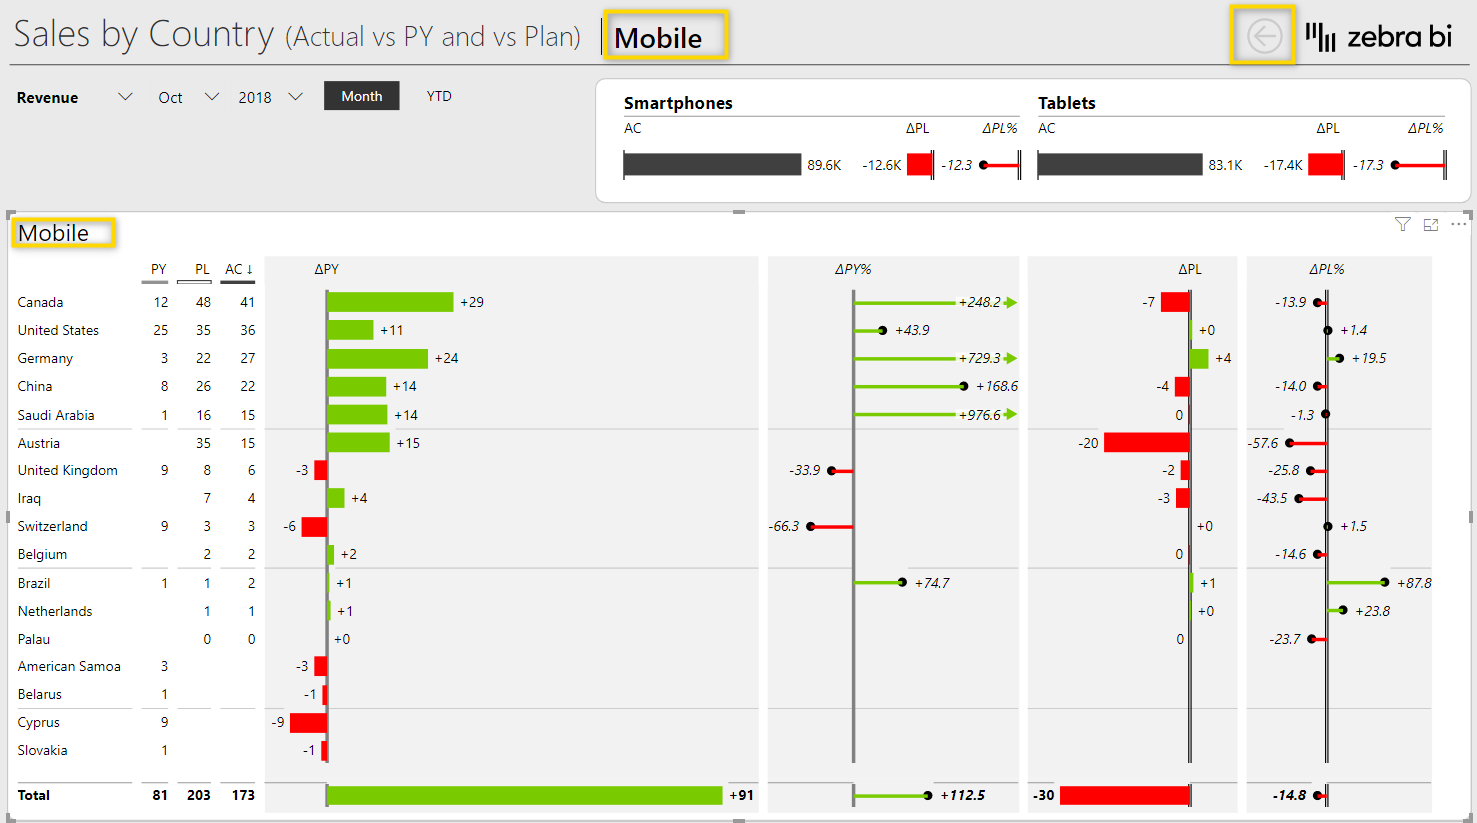
Whichever option you chose, you will land on the dedicated drill-through page which shows the details for the selected category and you can then analyze where the negative variance is coming from. Learn how to add dynamic titles to your visuals. Also note that each drill through page should always have a back button, which is actually added automatically during the setup of the page as you will see later.
This is how you add a drill-through page:
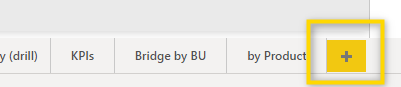
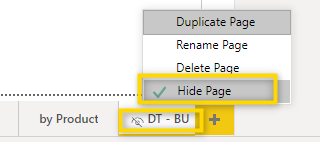
1. Add a new page to the report by clicking the + icon. Also, you should straight away rename the page and hide it so the end-user can only navigate to it via the drill-through function and not by selecting the actual page from the list of pages.
To easier find drill-through pages you can add the prefix DT (Drill-through) to the name and then indicate the table or dimension which is used for the drill-through. We are using a dimension from the BusinessUnits table so we called it DT – BU.
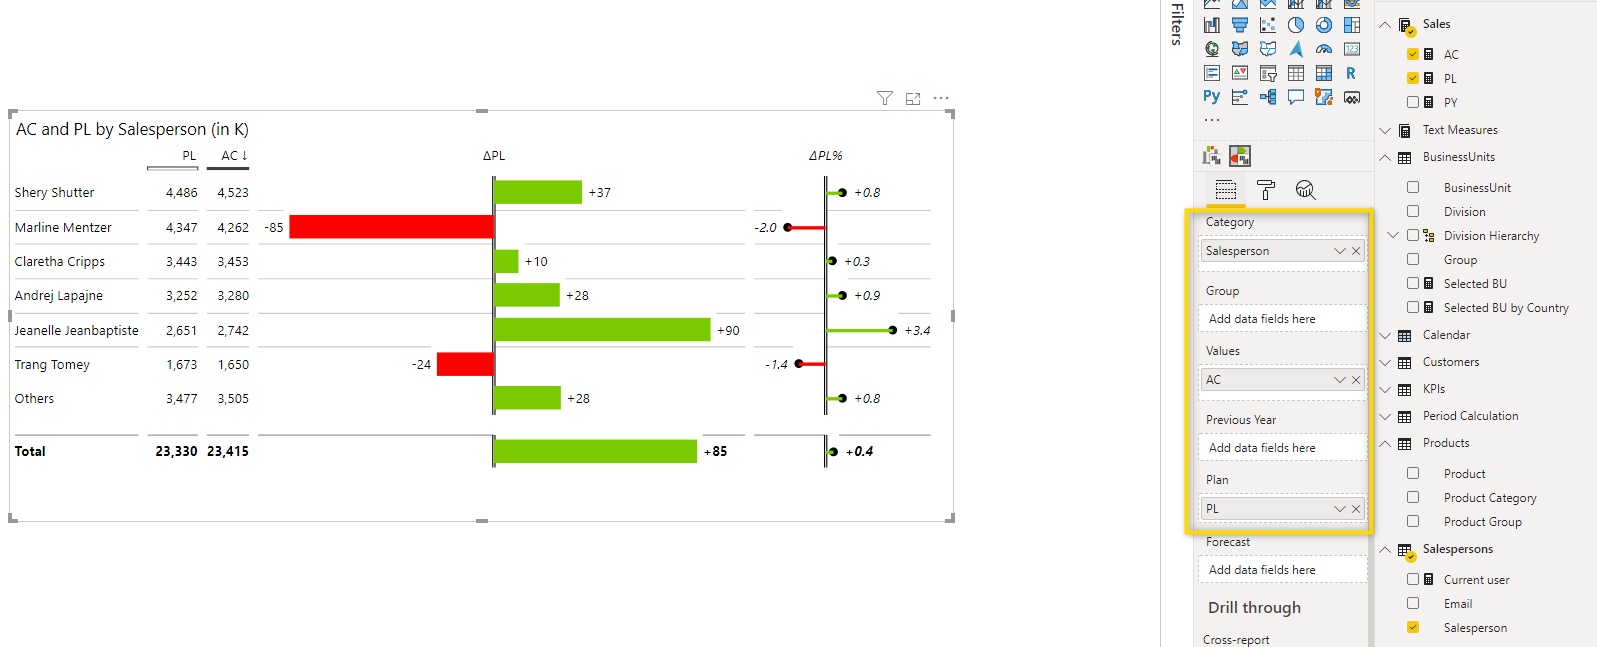
2. You can now add visuals to the page and design it the way you want it to be. For demonstration purposes, we’ve just added a simple Zebra BI Tables visual which compares Actuals and Plan Data per salesperson.
3. Now you need to define the dimension, for which this page will be a drill-through page. This dimension(s) needs to be added to the drill-through filters in the page settings. In our case, the Group dimension from the BusinessUnits table is the drill-through dimension because it is the one that is selected in the visual on the landing page and for which the details should be shown on the drill-through page. Once you have added the field, a button to go back to the previous page is automatically added to the page.
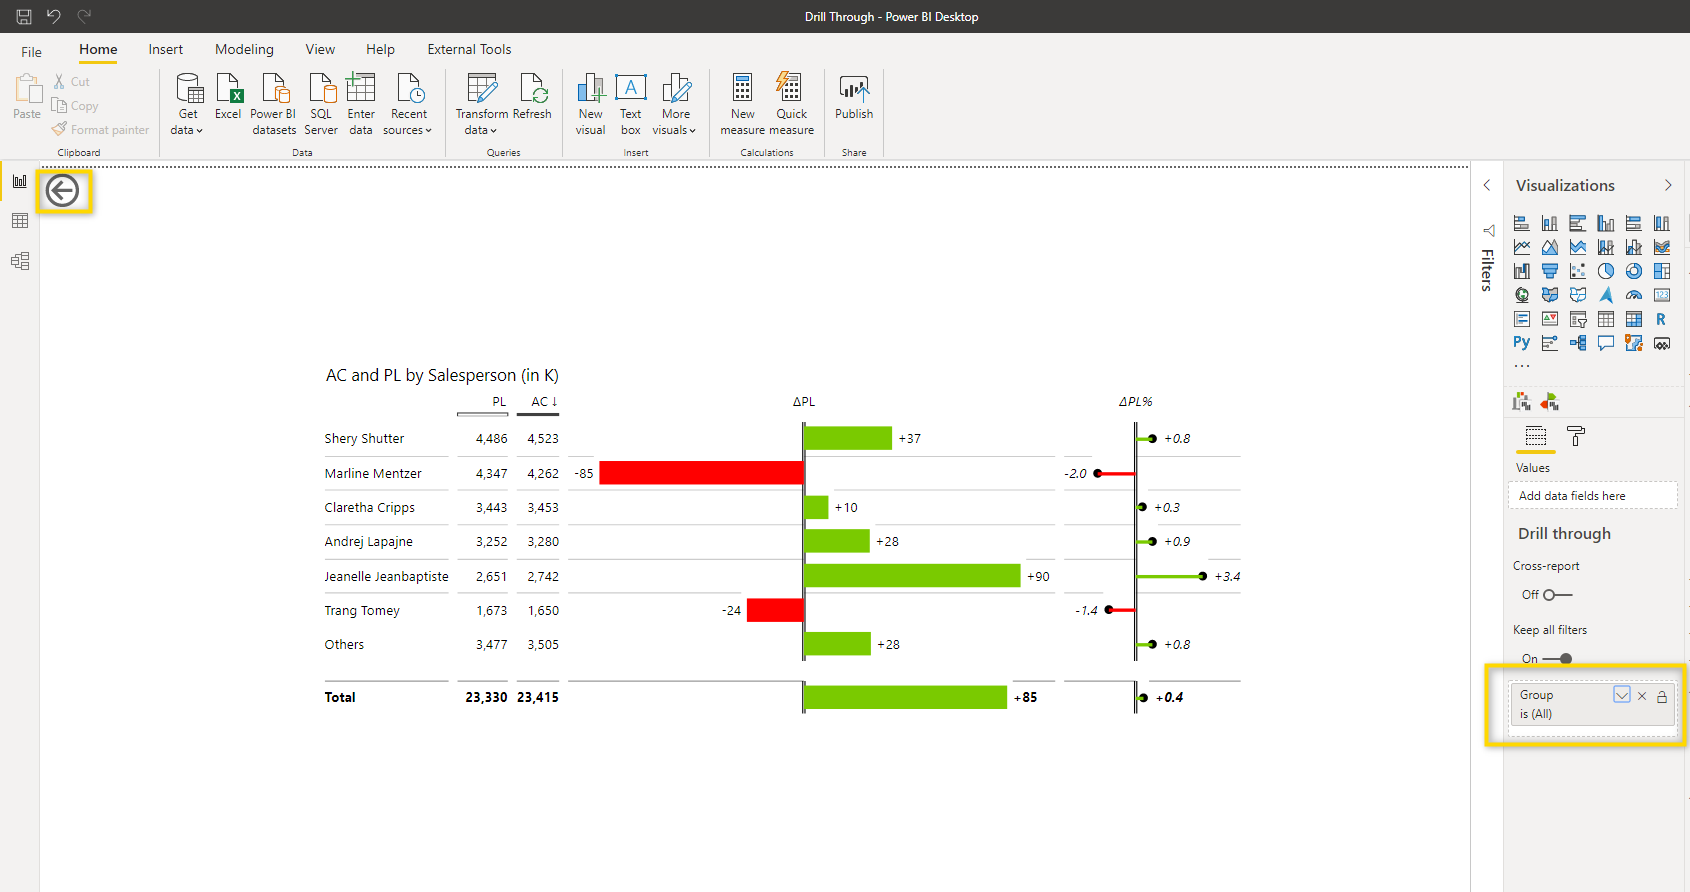
4. The drill-through page is now working as shown below. You can see that the value (-30) selected on the landing page is also the total in the drill-through page only this time it is split by the salesperson.
Of course, you would normally style the drill-through page much more but this article is only meant to illustrate the main functionality.
5. Add a button so the user doesn’t have to right-click and select the desired drill-through page. The default function with the right-click works fine but because you can style and conditionally format buttons, you can make it even easier for the end-user to navigate in a report. This article doesn’t focus on the styling of buttons, so we’ll only show you how to add a button that contains the drill-through functionality.
First, let’s add a blank button:
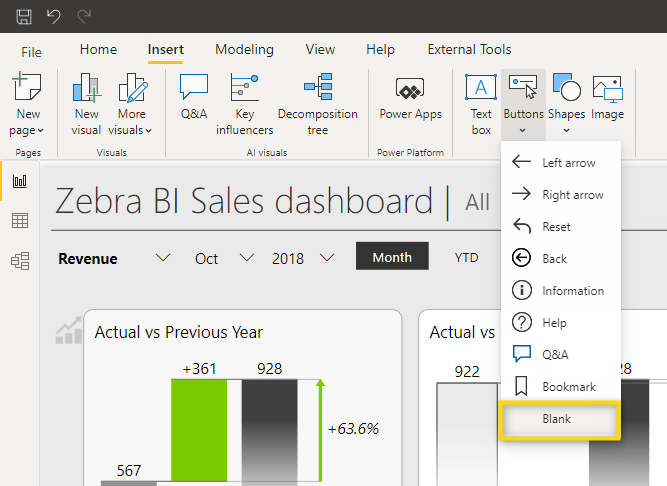
Now select the button and in the format settings, activate Actions and select Type > Drill through. Select the desired page in the Destination field. Note that there’s a conditional formatting button next to the Destination field which means you could also make this dynamic. You can also add tooltips that appear when the user hovers over the button. There’s a tooltip for when the button is enabled (the drill-through dimension has been selected) or when it’s disabled.
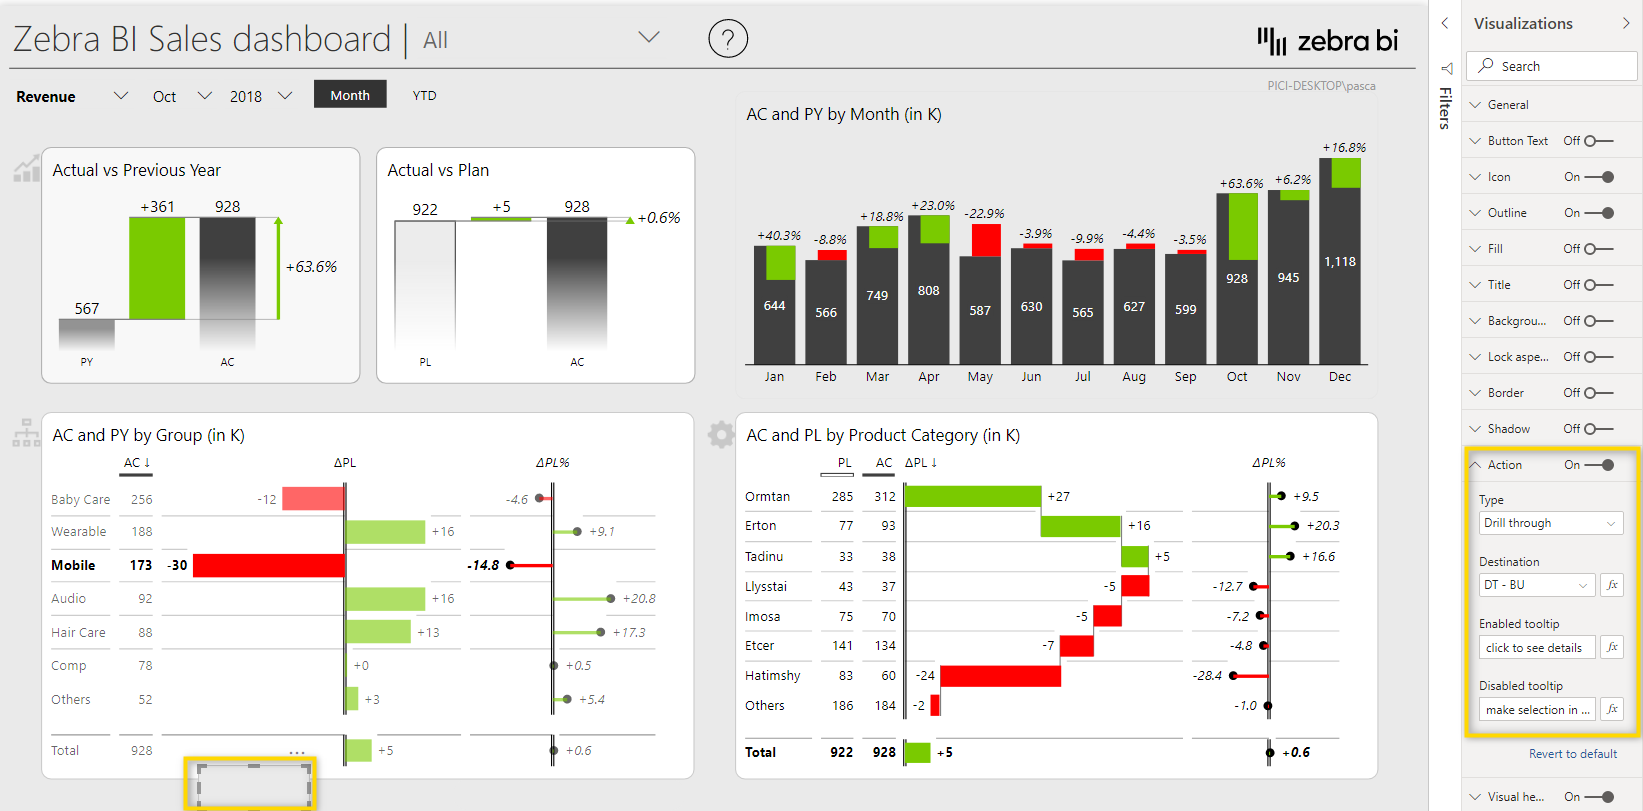
When you select a Group in the visual, the look of the button automatically changes because it becomes enabled. Adding a bit of formatting to it (similar to the yellow button on the right) makes this experience very easy for the user.
Now you know how to add drill-through pages which are a great tool to let the end-user dig into the details and see exactly, where the values are coming from. You could take this one step further and add another drill-through level. Like with many topics we discuss in this Knowledge Base, this is just to show you the main functionality. There are so many other amazing things you can do with this feature. Go ahead and try.