Power BI comes with many predefined data connectors that let you import data from different sources. Depending on the ERP or other source system your company is using, you will be using a different one of these connectors. But because it’s very common to start off with Excel as a data source and because we simply can’t describe every possible data source, we will show you how to import data from Excel.
The number of connectors is constantly increasing, find the full list. In case the source system you would like to use is not listed, don’t worry because there is also the possibility to create custom connectors.
⚠️ Important: The Zebra BI custom visuals work with all data sources.
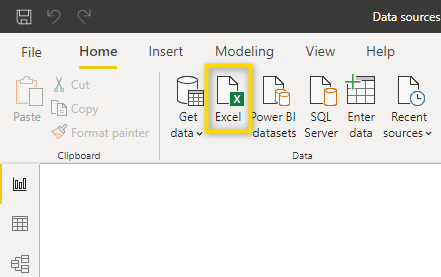
1. In the home tab, select Excel as a data source.
2. Navigate to the file you would like to load and click Open.
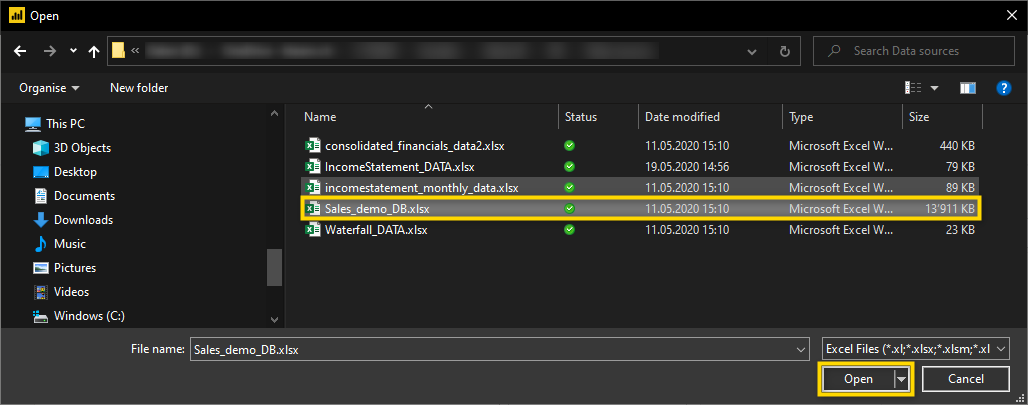
The Excel file which is loaded must be closed during the load.
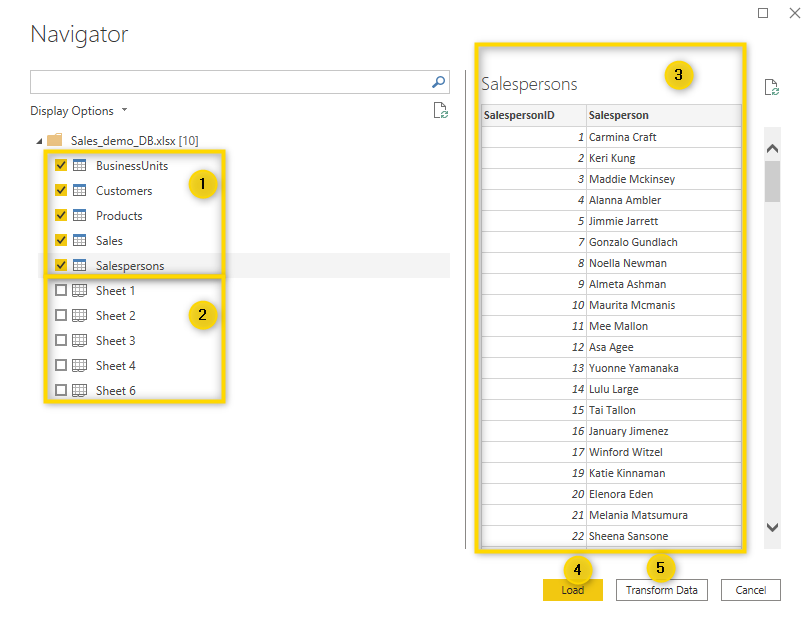
3. In the Navigator window, you need to select the elements which you want to load into the Power BI data model. In our sample, we are loading 5 tables into the data model. Of course, you can also load tables from different Excel files or other data sources into the same Power BI report.
Legend:
- This icon indicates that the shown object is defined as a table in Excel. It’s considered best practice to import tables.
- This icon indicated that the shown object is an Excel sheet. In case the data is not defined as a table and you can’t make any changes to the source file, importing data from worksheets is also fine but might lead to issues when the data in the sheet grows.
- The preview window shows what the data looks like.
- The Load button loads the data directly to Power BI Desktop. While many people do this, we recommend clicking Transform Data instead because this gives you more options to clean up the data before it’s loaded to the report.
- Transform Data opens Power Query Editor, which is considered best practice because in many cases, some basic transformations (even if it’s only renaming) need to be done before the data is loaded to Power BI Desktop.
In this case, all tables have been selected and then Transform Data was clicked.
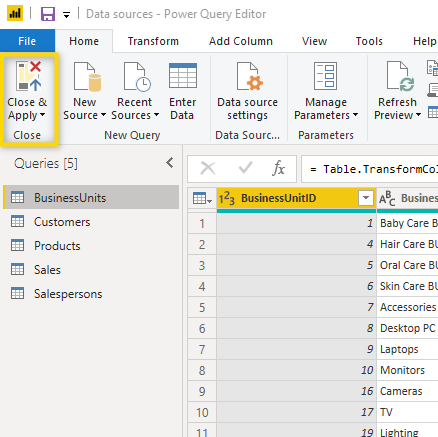
4. Power Query Editor
After clicking Transform Data, the selected tables are loaded to Power Query Editor where you should make some general checks.
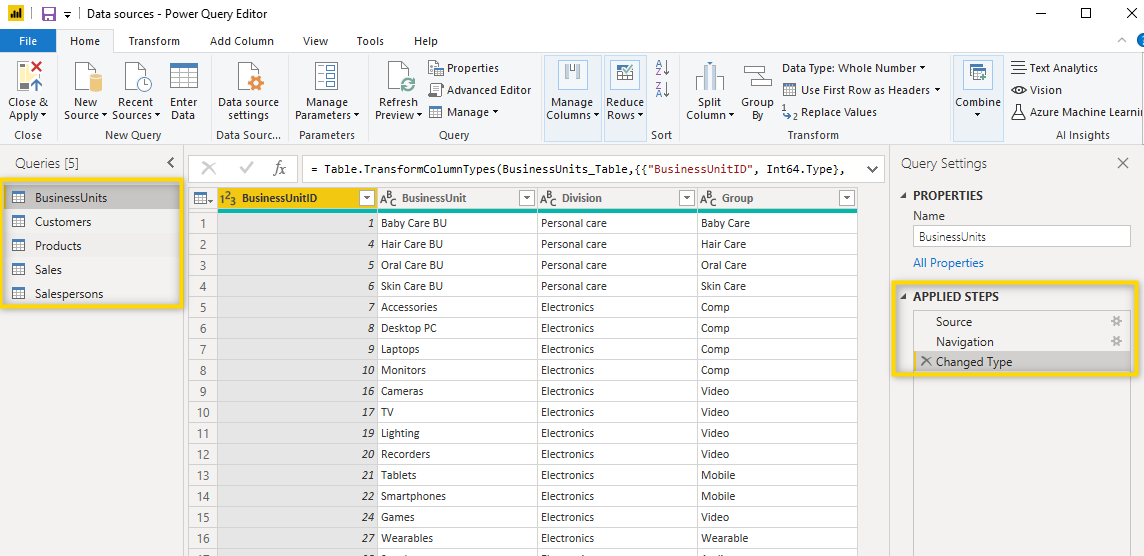
In Power Query Editor you can see all previously selected tables have been loaded into separate queries. In the section Applied steps on the right-hand side, you can see that 3 steps have automatically been added to the query:
- Source: This step accesses the Excel File;
- Navigation: This step navigates to the table which has been selected;
- Changed Type: Depending on the values in each column, Power Query Editor changes the type of each column. In this case, the column BusinessUnitID contains numeric values, therefore this column has been defined as a whole number column automatically while the column BusinessUnit is defined as text.
You should now go through all of the 5 queries and check the definition of each column. At the same time, make sure that the queries have a proper name. Once checked if everything is correct, the data can be loaded to Power BI Desktop. To do this, click Close & Apply. In case more changes or transformations are needed, you can always go back to Power Query Editor.
Find more details about Power Query Editor. Also, discover the best practice tips and tricks.
5. Once you have loaded the queries into Power BI Desktop, you can see all the imported tables in the Fields list.

6. Maintain Relationships
In most cases, the first thing you want to do after loading data is to go to the Model view and check if all the relationships have been created correctly. To learn more about data modeling and relationships between tables, you should look at the article about the Star Schema.
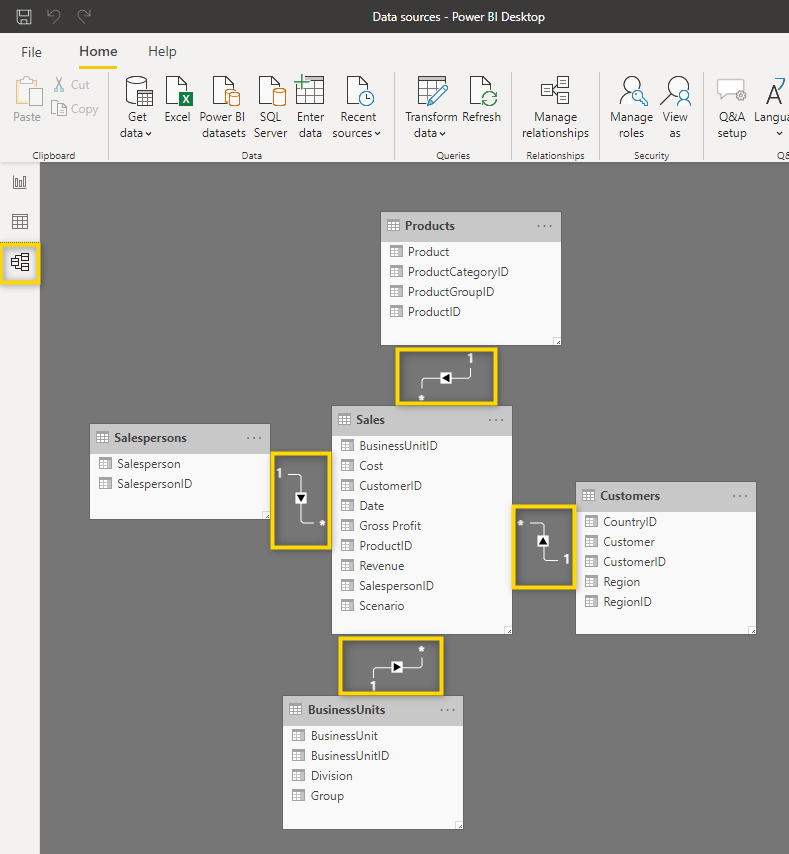
In simple data models, the automatically created relationships are correct but when a report becomes more complex, automatically created relationships might be wrong. We, therefore, recommend turning off automatic relationships in the options.
To do this, follow these steps:
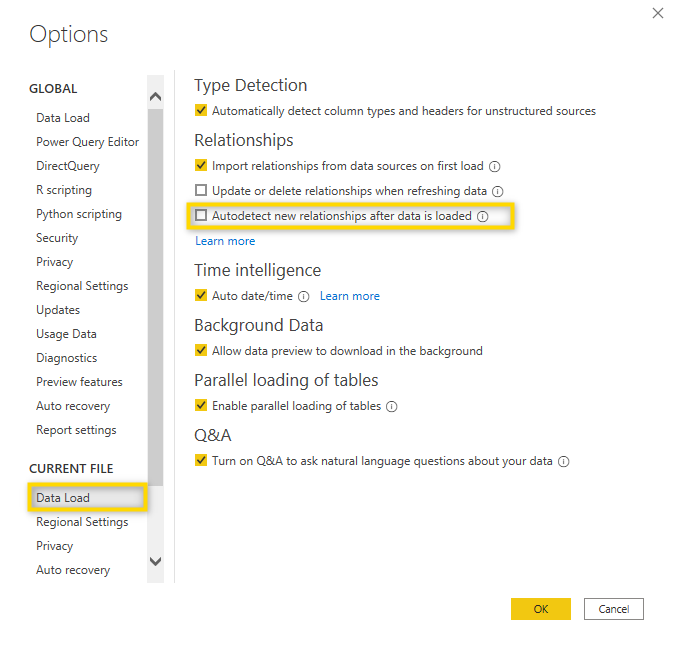
1. Head to Options and settings.
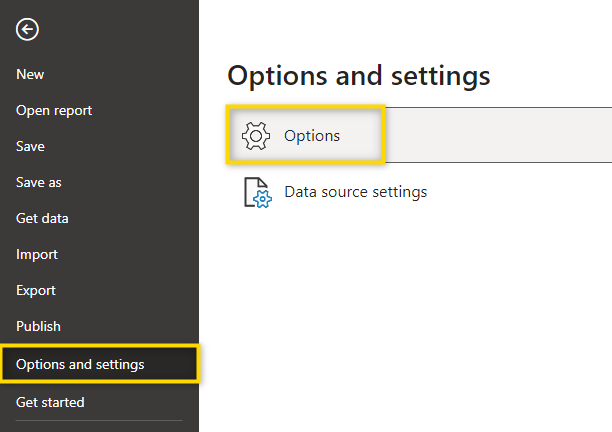
2. Uncheck ” Autodetect new relationships after data is loaded“.
Once the correct relationships are set up, you can start to create a Power BI report. The most common next steps are:
1. Create calendar or date table →
2. Create basic measures →
Loading data from Excel to Power BI is a skill that you will be using many times when working with Power BI. Even if the final report will be linked directly to a database, whenever you need to add a custom table, loading it from Excel is a simple and good option.