The best way to consolidate your KPIs is to use the DAX language (SWITCH statement), usually in combination with a disconnected table. The last article of the series helps you utilize the most useful and powerful approach, with high flexibility in setting up KPIs.
Preparing data article series
- Single card
- Basic Card with a single Excel table
- Power Query (more advanced)
- DAX/Switch (the most flexible)
Learn how to use the DAX language to consolidate your data for an actionable KPI dashboard.
You can use the same PBIX example as Mark did in the video. Download it below.
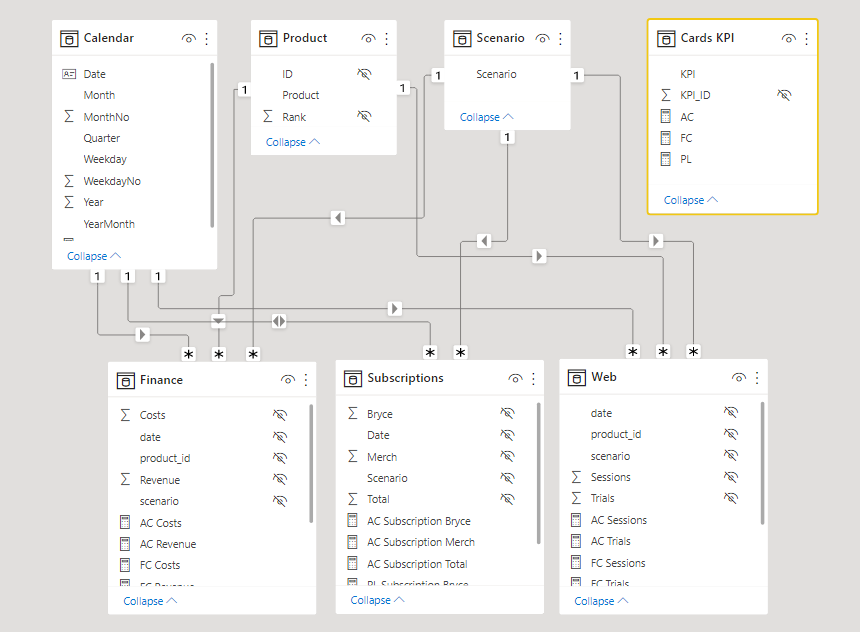
Looking at our data model, we have three fact tables already containing several measures, three dimensions tables, and a disconnected Card KPI table. We want to consolidate them all.
Let’s check how the disconnected Card KPI table looks like. It’s essentially a list of all the KPI elements (with the KPI Id) we want to introduce to our data model and use it with Zebra BI Cards visual.
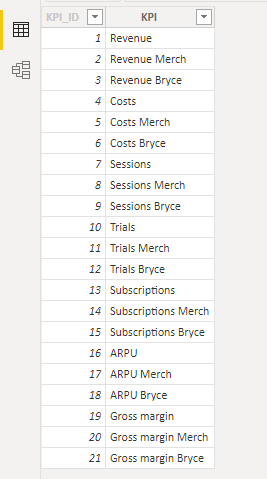
How can we leverage this simple table to present our KPIs?
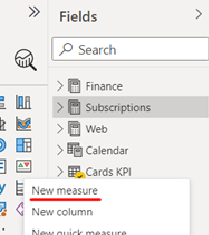
Using a DAX SWITCH statement we’ll create a new measure that will calculate the Actuals for every single KPI element in our disconnected table (Cards KPI).
Create a new measure by right-clicking on the element in the Cards KPI table and selecting the New measure option:
As usual, we’ll start with the AC value and we’ll write a SWITCH statement. The first argument of the SWITCH statement needs to be some sort of aggregation that will tell you on which KPIs you’ll actually be writing the values. After that, you can specify the names of the KPIs you want to present.
You can copy and paste the following DAX query to easily recreate the measure:
AC = SWITCH(MIN('Cards KPI'[KPI]),
	 "Revenue",Finance[AC Revenue],
	 "Revenue Merch", CALCULATE(Finance[AC Revenue],'Product'[Product]="Merch"),
	 "Revenue Bryce", CALCULATE(Finance[AC Revenue],'Product'[Product]="Bryce"),
	 "Costs",Finance[AC Costs],
	 "Costs Merch", CALCULATE(Finance[AC Costs],'Product'[Product]="Merch"),
	 "Costs Bryce", CALCULATE(Finance[AC Costs],'Product'[Product]="Bryce"),
	 "Sessions", [AC Sessions],
	 "Sessions Merch", CALCULATE([AC Sessions], 'Product'[Product]="Merch"),
	 "Sessions Bryce", CALCULATE([AC Sessions], 'Product'[Product]="Bryce"),
	 "Trials", [AC Trials],
	 "Trials Merch", CALCULATE([AC Trials], 'Product'[Product]="Merch"),
	 "Trials Bryce", CALCULATE([AC Trials], 'Product'[Product]="Bryce"),
	 "Subscriptions", Subscriptions[AC Subscription Total],
	 "Subscriptions Merch", Subscriptions[AC Subscription Merch],
	 "Subscriptions Bryce", Subscriptions[AC Subscription Bryce],
	 "ARPU", Finance[AC Revenue] / Subscriptions[AC Subscription Total],
	 "ARPU Merch", CALCULATE(Finance[AC Revenue],'Product'[Product]="Merch") / Subscriptions[AC Subscription Merch],
	 "ARPU Bryce", CALCULATE(Finance[AC Revenue],'Product'[Product]="Bryce") / Subscriptions[AC Subscription Bryce],
	 "Gross margin", [AC Revenue] - Finance[AC Costs],
	 "Gross margin Merch", CALCULATE([AC Revenue] - Finance[AC Costs] ,'Product'[Product] = "Merch"),
	 "Gross margin Bryce", CALCULATE([AC Revenue] - Finance[AC Costs] ,'Product'[Product] = "Bryce")
	 )
If you want the Cards to display a measure that you already have in one of the tables from the data set (e.g., revenue is already in the Finance table), you can use this same measure when writing it in the DAX query. Simply select it from the dropdown that appears when you start writing. You can also easily combine measures from different tables (e.g., revenue from Finance and Merch from Product to display only the Revenue for Merch).
You can also reuse certain KPIs. Be mindful of a small difference in syntax for the Average Revenue per Unit (ARPU) KPIs, that uses the elements which were previously defined in the same DAX query. This can be a good approach where you can create multiple additional KPI elements (with simple copy/paste) by reusing existing calculations (e.g., Average Revenue per unit (ARPU) can be calculated as Revenue divided by the Total AC for Subscriptions).
Using the SWITCH function, we have defined the “rules” for each KPI. The first KPI “Revenue” is only defined by the “AC Revenue” measure from the Finance table. The second and the third KPIs are based on the same measure but are specifically filtered for products Merch and Bryce.
Defining the formula for Cost, Sessions, Trials, and Subscriptions follows the same pattern.
Now let’s create two more measures – Plan (PL) and Forecast (FC). This is a simple process if the data model is organized consistently, and you know a simple trick in DAX editor.
Create a new measure using the same DAX statement, highlight the measure name “AC”, press Ctrl + Shift + L (that will highlight all the instances with the originally highlighted text), and simply write ”PL”. Done.
Let’s do the same for the Forecast (FC) measure.
But be careful! The Subscription fact tables do not contain data for Forecast, so will have to remove all the KPI’s that are referencing the Subscription table. Don’t worry, you can also copy-paste the following query:
FC = SWITCH(MIN('Cards KPI'[KPI]),
	 "Revenue",Finance[FC Revenue],
	 "Revenue Merch", CALCULATE(Finance[FC Revenue],'Product'[Product]="Merch"),
	 "Revenue Bryce", CALCULATE(Finance[FC Revenue],'Product'[Product]="Bryce"),
	 "Costs",Finance[FC Costs],
	 "Costs Merch", CALCULATE(Finance[FC Costs],'Product'[Product]="Merch"),
	 "Costs Bryce", CALCULATE(Finance[FC Costs],'Product'[Product]="Bryce"),
	 "Sessions", [FC Sessions],
	 "Sessions Merch", CALCULATE([FC Sessions], 'Product'[Product]="Merch"),
	 "Sessions Bryce", CALCULATE([FC Sessions], 'Product'[Product]="Bryce"),
	 "Trials", [FC Trials],
	 "Trials Merch", CALCULATE([FC Trials], 'Product'[Product]="Merch"),
	 "Trials Bryce", CALCULATE([FC Trials], 'Product'[Product]="Bryce"),
	 "Gross margin", [FC Revenue] - Finance[FC Costs],
	 "Gross margin Merch" , CALCULATE([FC Revenue] - Finance[FC Costs] ,'Product'[Product] = "Merch"),
	 "Gross margin Bryce", CALCULATE([FC Revenue] - Finance[FC Costs] ,'Product'[Product] = "Bryce")
	 )
Congratulations, you now have the data model ready to display all your KPIs consolidated in one Zebra BI Cards visual.
Now let’s create an awesome Cards report with just a few clicks. Let’s add the KPI name dimension to the Group (KPIs) placeholder and Add the AC measure to the Values placeholder. You should see all your KPIs neatly organized within one visual.
Add the Month from the Calendar table to the category placeholder for the time component and top it all off with adding PL to the Plan placeholder or FC to Forecast placeholder as comparison measures.
Congratulations, you’ve come to the very end of the process! Enjoy your actionable KPI dashboard with Zebra BI Cards visual.