This article will teach you how to link data from Excel to PowerPoint with Zebra BI for Office in three easy steps. This is a very sought-after functionality that Zebra BI for Office delivers as an easy and seamless way to convert numbers in Excel to actionable visuals in your PowerPoint presentations.
With the Auto-refresh feature, you will never again have to worry if your PowerPoint slides are up to date, as all the changes made in Excel will be automatically transferred onto your slides each time you open your PowerPoint file.
Launch PowerPoint and Zebra BI
You can insert a Zebra BI visualization by following the next steps:
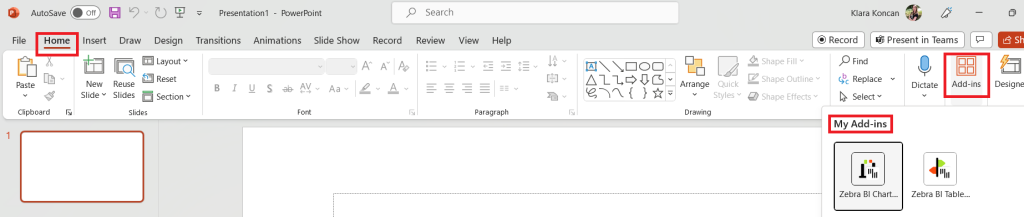
- Click anywhere inside the table
- Move to the Home tab > Add-ins
- Select any of the two Zebra BI add-ins for Office
Then choose your desired visualization type from the options available.

Specifying the Data Source
Within the Zebra BI options panel, find Link data to Excel button.
This will open a file explorer that will allow you to search for your desired Excel file saved on your SharePoint or OneDrive. When you find the file select it and you will be able to see all the available options for data linking.
📌Important: At some point, you could get a pop-up saying “Need admin approval. This app requires permission to access resources in your organization that only an admin can grant.” This means the application wants access to your Microsoft organization’s data (OneDrive, SharePoint), as your IT administrator has restricted which apps can be installed or given permissions. You will need to reach out to your IT department to get this approved.

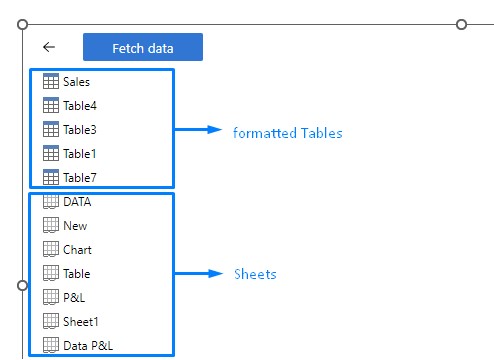
You have the option to select between sheets or formatted tables in the file you selected.
Updating and changing data
When there is a need to update or either change the existing data there are additional settings available on the Data editor icon.
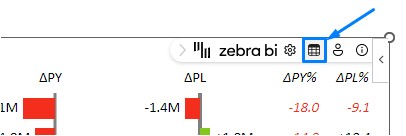
There are several settings accessible in the top bar:
- Edit link – Change the existing link to another Excel file or table
- Remove link – Completely remove the link
- Refresh data – Manually refresh data in the visuals
- Auto-refresh – Toggle automatic updates for linked visuals
Make sure to save the linked Excel file every time your data changes to ensure that PowerPoint pulls the most recent data.

Enabling Auto-refresh
To enable Auto-Refresh for linked visuals in PowerPoint toggle the Auto-Refresh option to ON.

Once enabled, the visual will automatically update whenever the PowerPoint file is opened.
If a refresh fails due to missing data sources or connection issues, the data grid will open automatically, and an error notification will appear:

Known limitations of the Auto-refresh feature
- Excel Online and AutoSave delays
- Editing linked data in Excel Online or relying on AutoSave may cause delays in updates.
- Best practice: Save changes manually in the desktop version of Excel before reopening PowerPoint.
- PowerPoint Desktop behavior
- Visuals only update when a slide is actively viewed.
- Users must click through slides to ensure all visuals refresh properly. This limitation doesn’t apply to PowerPoint Online, where all visuals on all slides are updated automatically when the file is opened.
- This is a Microsoft API limitation, and Zebra BI is working on possible solutions.
With Zebra BI for Office, your PowerPoint presentations will always stay up to date with the latest Excel data—no manual updates needed. Enable Auto-Refresh for even greater efficiency and enjoy seamless, actionable reporting.