In this article, we will guide you through the process of applying Style Editor, one of Zebra BIs’ key features, using JSON theme to enhance your corporate branding with Zebra BI.
By using JSON theme, you can easily define and modify various visual elements such as colors, fonts, and layout settings to match your company’s brand identity.
Step 1 – Save the existing theme from the Add-in
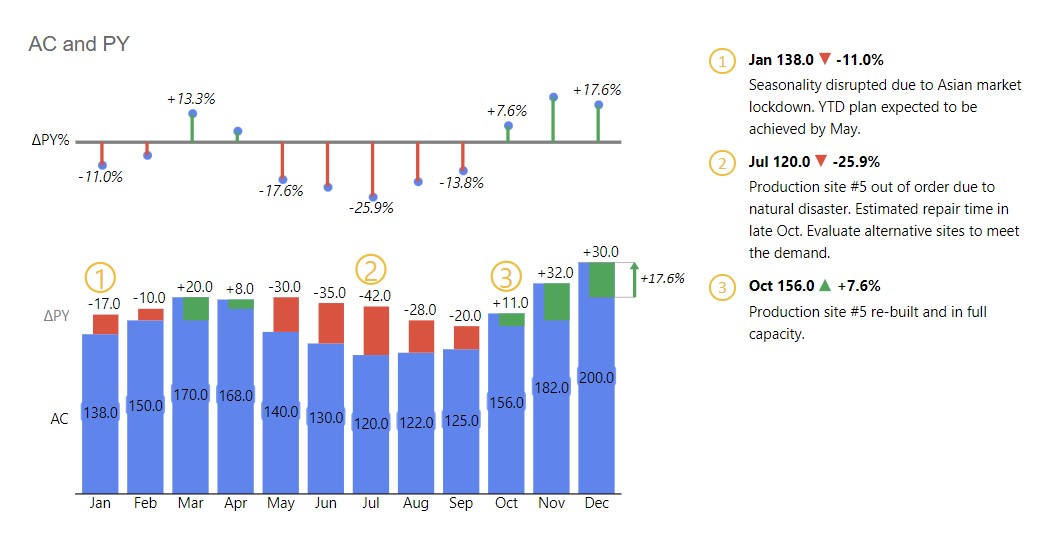
By default, Zebra BI offers some predefined themes and designs that are IBCS compliant. We still want to allow our users to make their own customizations so your dashboards and presentations will also reflect companys branding. Since good company branding is applicable to businesses, we decided to enable Style editor feature only for Starter, Advanced, and Enterprise plans.
To start modifying the existing settings click on the Gear icon in the top right corner, which will lead you to the settings menu.
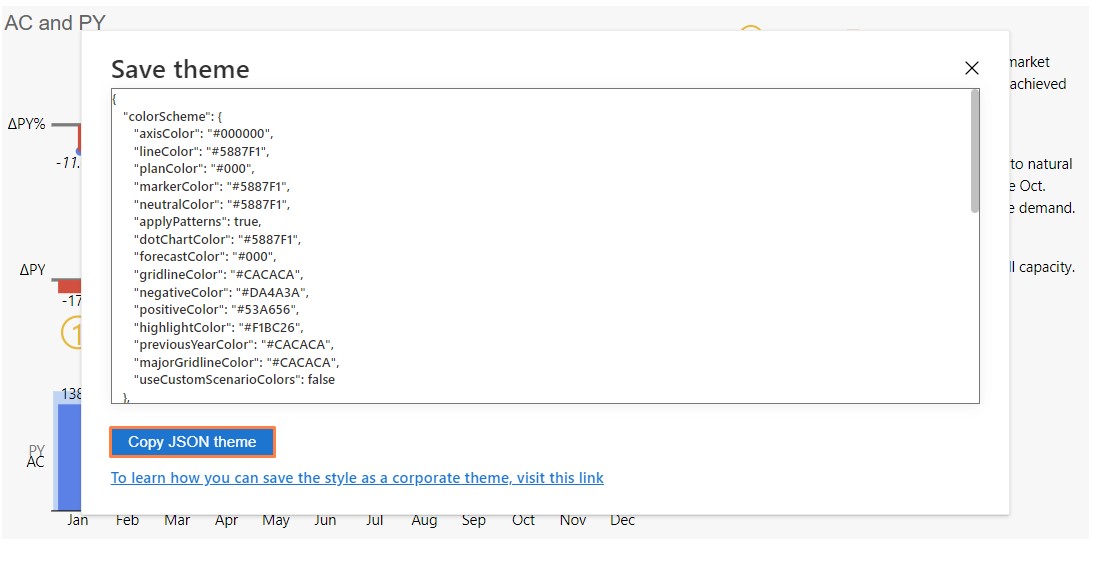
After you have finished personalizing the visual you can click on the “Save theme” button at the top of the settings.
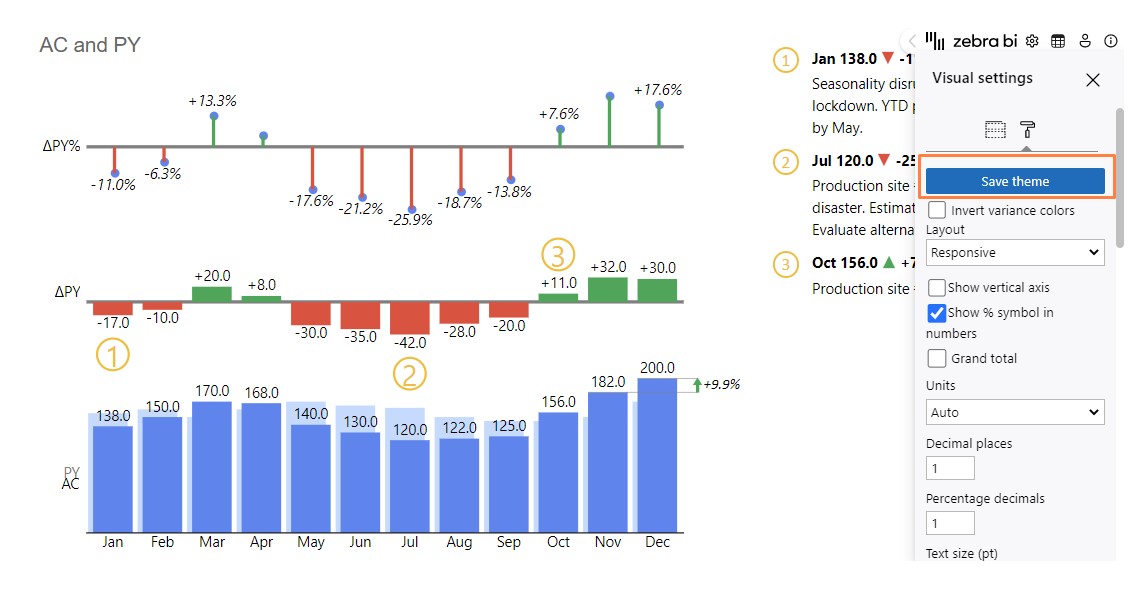
This will open a new window with the JSON theme code which can be copied. In the next steps, we’ll show you how to apply this throughout all Zebra BI add-ins.
Step 2 – Access the Style editor
When you want to apply your own JSON theme you will first need to visit the Style editor page to apply your company branding to all reports.
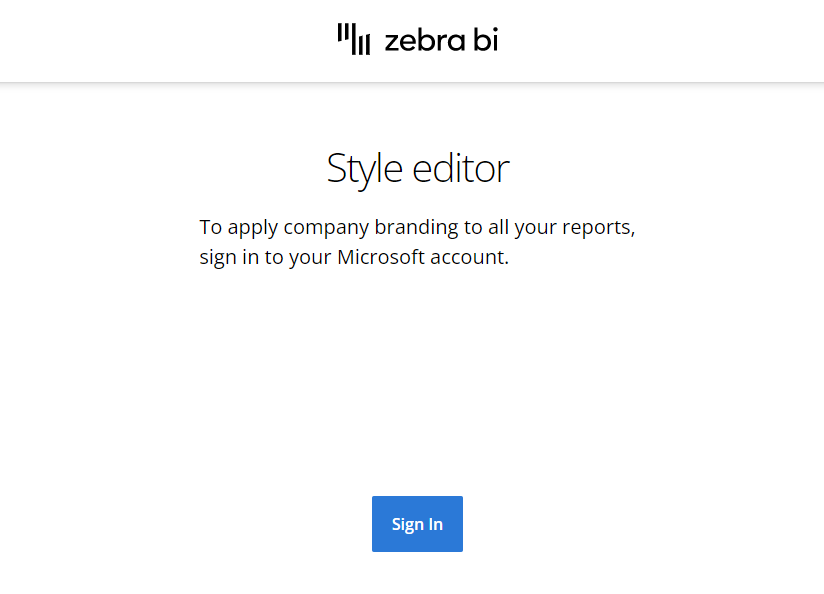
Step 3 – Sign in with your Microsoft account
The link above will redirect you to the page where Signing in to the Microsoft account is required.
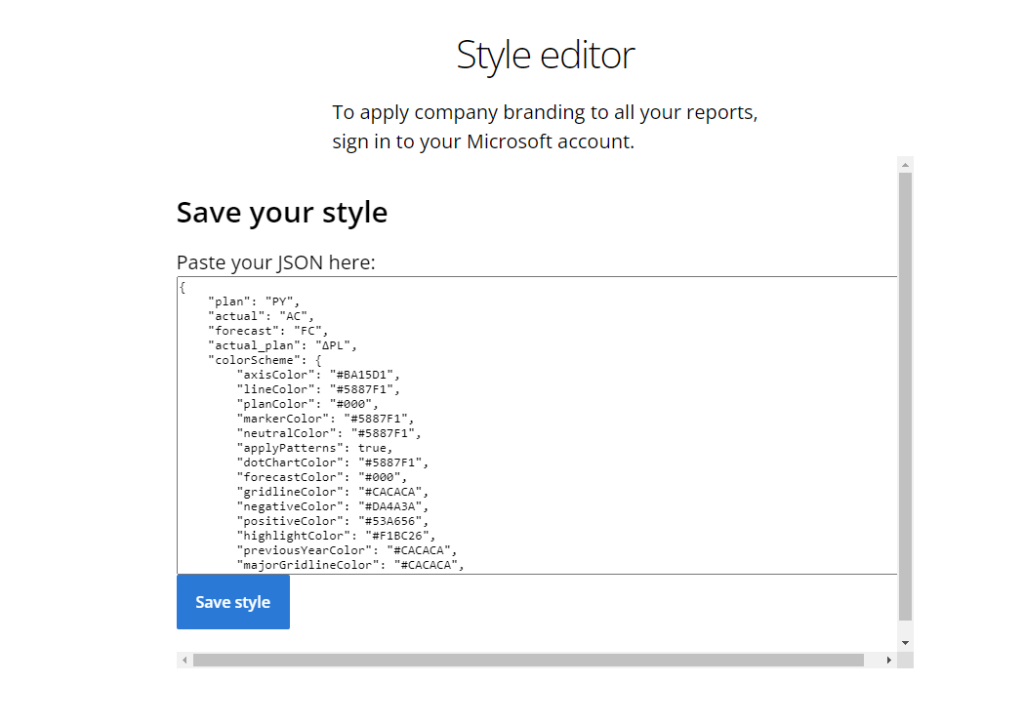
Step 4 – Copy & Paste your JSON inside the box
Once you’ve signed in the editor appears where you can paste in an existing theme or edit the one that is already inserted.
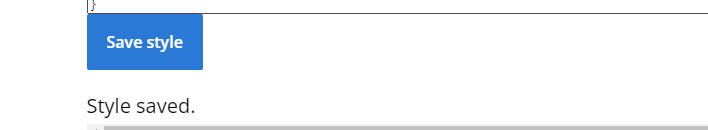
Step 5 – Save your style
When you’re done with the editing, click on “Save style” button and the “Style saved” text will inform you that the changes have been saved to your account and consequently also to the whole company via domain.
Step 6 – Check if your reports are updated with appropriate styles
Now it’s time to check out the theme you’ve saved in the editor. Open your PowerPoint presentation and insert any Zebra BI add-in.
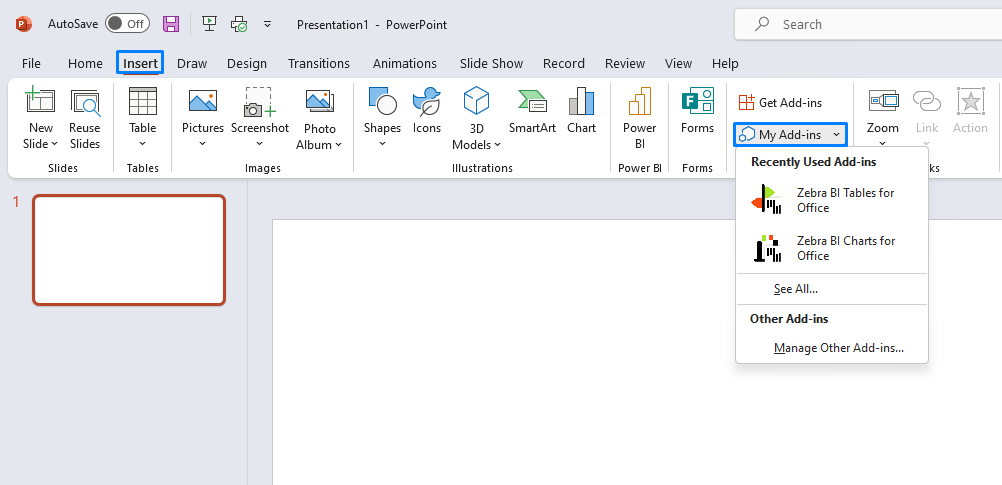
Selecting a Zebra BI add-in will lead you to the Chart chooser, where various chart types are available for you to choose from and all of them come with additional descriptions.
When any chart is selected the theme you’ve set up earlier will immediately get applied in the newly created visual. If you would like to modify this new theme you can simply go back to Settings, make changes and click on “Save theme” again, return to the Style Editor, and repeat the process.