Data sorting is one of the common things we do when interacting with a report or when just simply exploring the data. The Zebra BI Tables for Office in PowerPoint allows all users to quickly sort by any column in the visual simply by clicking on the column header.
This toggles between three different sorting options:
- Descending
- Ascending
- Custom
The descending sort order is the default setting when the visual is created. This will sort your data from the highest to the lowest value.
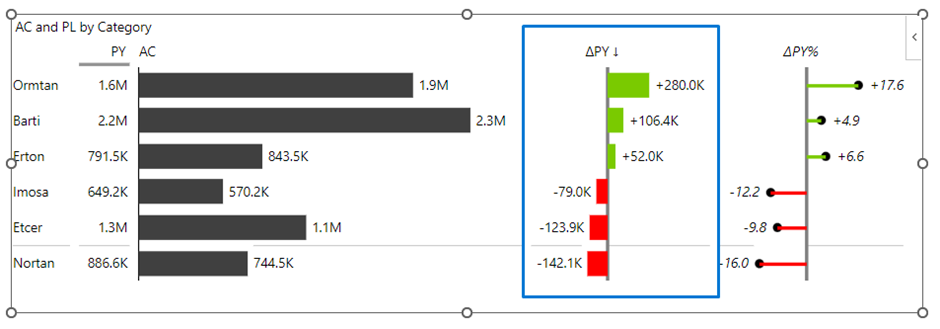
Typically we use the descending sort order when we want to organize data in a certain way. Sales performance, for example, can be sorted descendingly so that we have our top-selling categories at the top and the worst-selling ones at the bottom.
The ascending sort order is very similar, the only difference being the direction of sorting. As the name implies, this sorting option enables you to sort your data the other way around, from the lowest to the highest values.
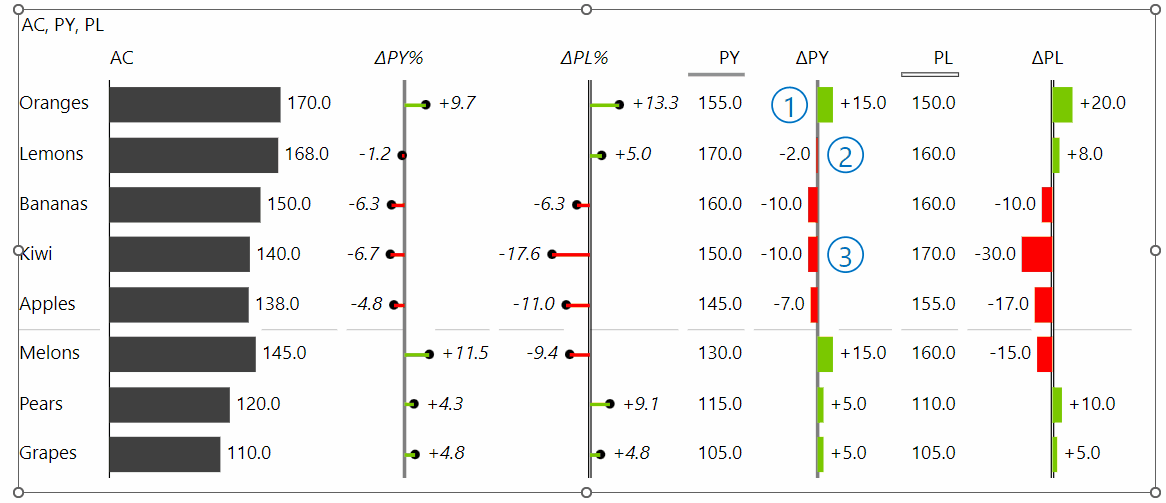
Sorting can also come in handy with variance columns. Apply it to either absolute or relative variance to put your best-performing (compared to comparison values like PL, PY, FC, etc.) element at the top and the worst-performing one at the bottom as demonstrated in the picture below.
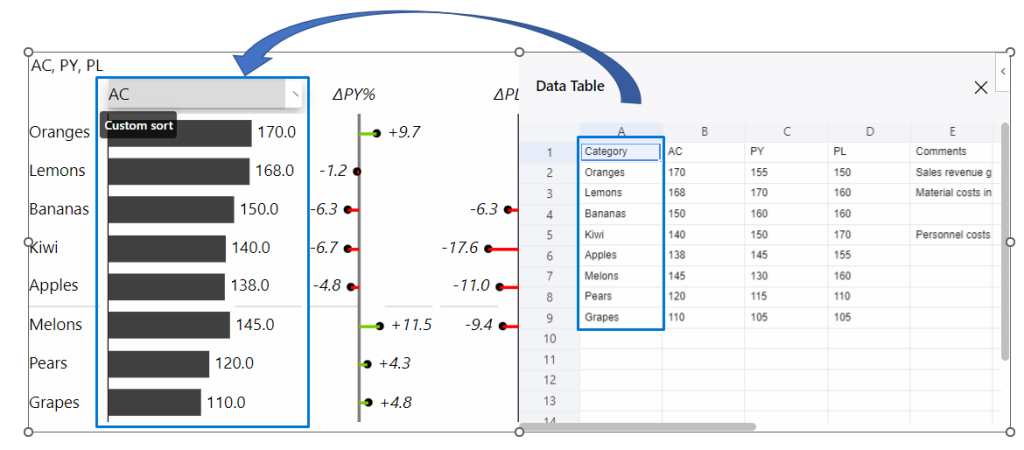
In some cases, we want to preserve the sort order of our categories – to have it in the same sort order as in the data table. Typically that is the case with financial reports, where we want to have a fixed structure of our (financial) categories. In this case, we need to go with the custom sort order as demonstrated in the picture below.