To start creating stunning reports with the Zebra BI add-in for Office in PowerPoint, you just need to import them from the Microsoft AppSource into your PowerPoint: online or desktop. To unlock the full (Pro) version, you have to start the 14-day free trial.
Import visuals from Microsoft AppSource
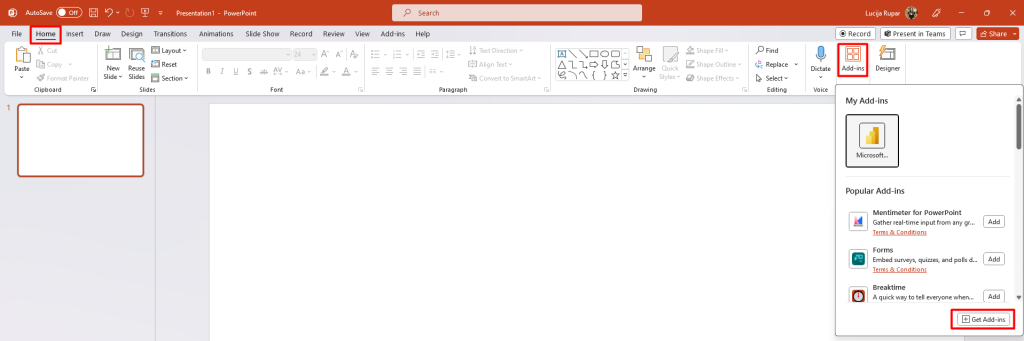
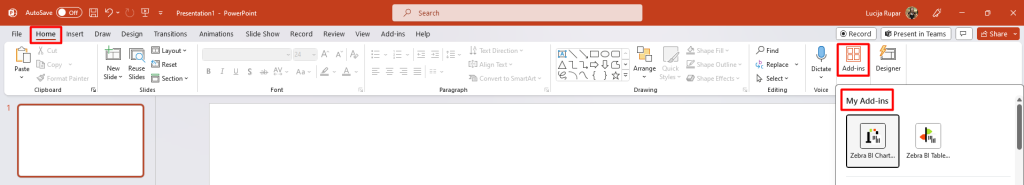
In your PowerPoint, go under the Home tab and click on Add-ins. Click on the Get Add-ins button at the bottom.
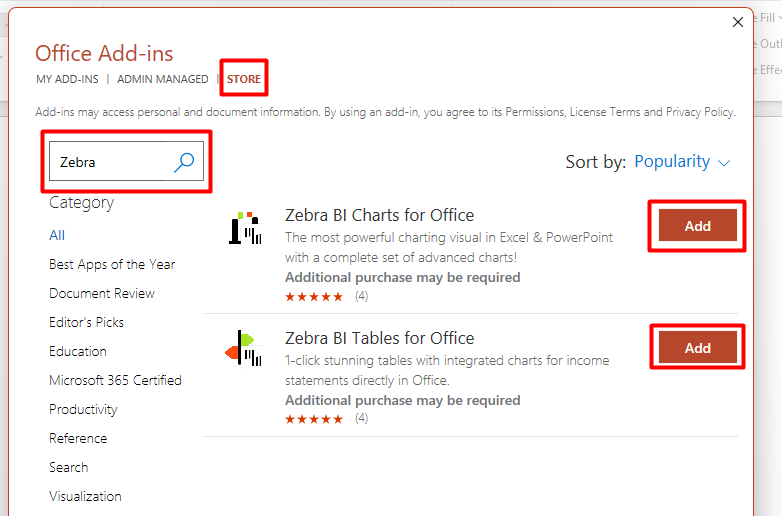
Search for ”Zebra” in the Store to find Zebra BI Tables for Office and Zebra BI Charts for Office. Click on the Add button.
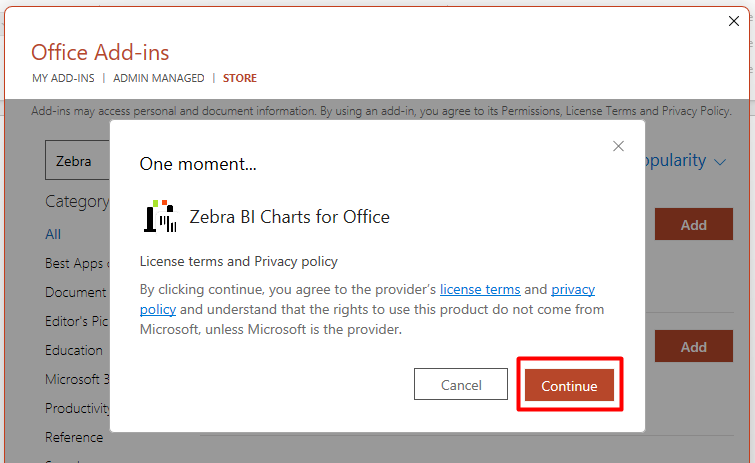
After you click on the Add button, you will be asked to confirm the terms of use and privacy policy. Click on the ‘Continue’ button.
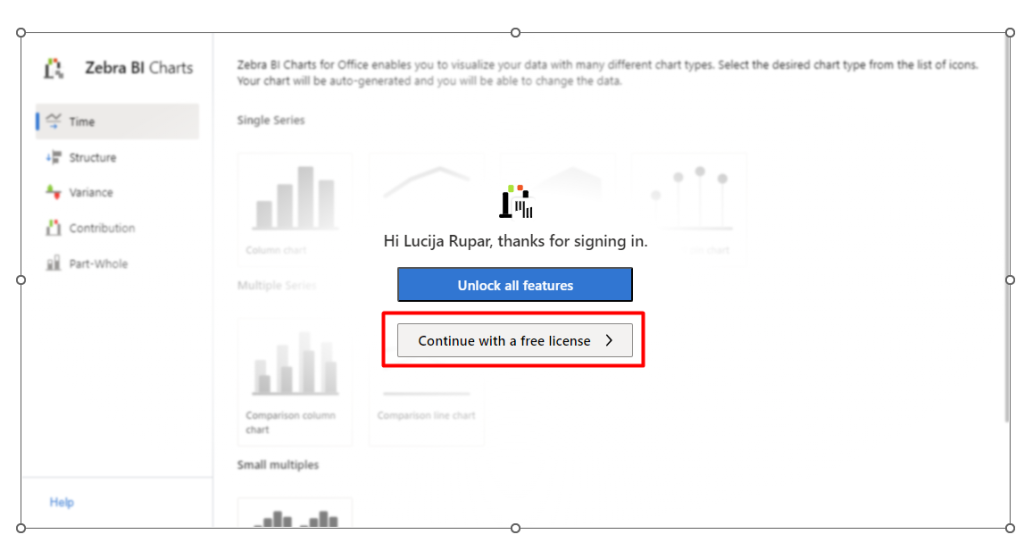
After the confirmation, the add-ins will open automatically and you will need to sign in to your Microsoft account. If you’re already signed-in, you will not see this.
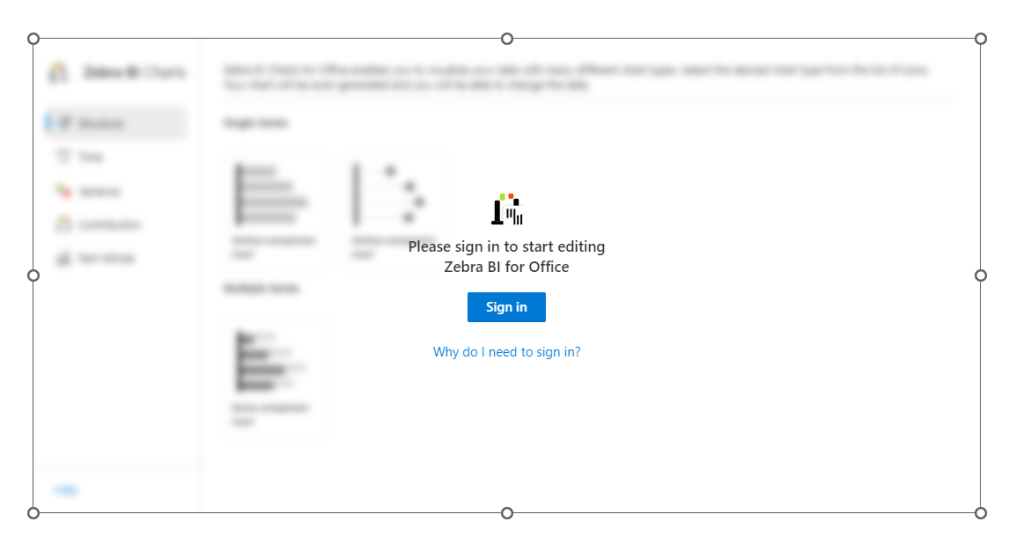
To start using the product for free choose the ‘Continue with a free license option.’
The next time you want to start using the add-ins, simply repeat the first step: under the Home tab, click on Add-ins, and you should see one or both Zebra BI add-ins under ‘My add-ins’ section.
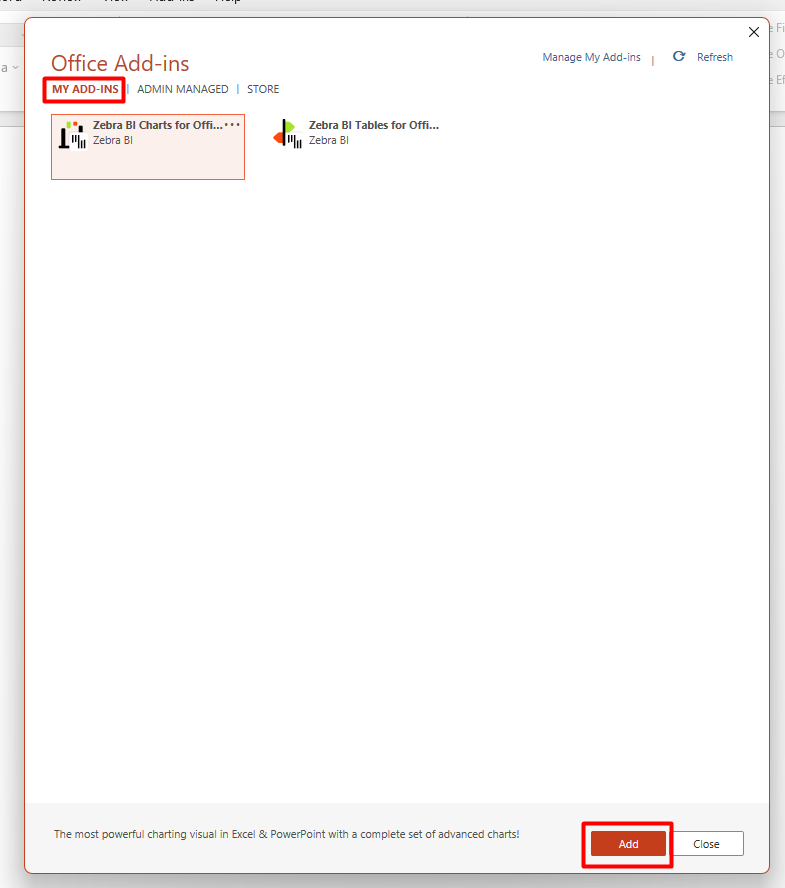
If you don’t see the add-in(s) here, click on Get Add-ins button at the bottom. After the pop-up opens, click on the tab My add-ins, and you will find them there. Select the one you want to insert and click on Add at the bottom.
Add your data to start using add-ins
Once you add the add-ins to PowerPoint, the so-called ‘Chart chooser’ or ‘Table chooser’ will open up.
On the first page, you will need to select the layout that best suits your needs for the presentation. When you make your selection, the chart or table will be created automatically, with some dummy data in the data editor.
To change the data to your own, you can either change it manually or use the link to Excel option.
For the first option, open the data editor and simply copy-paste it from your original file to this data editor in PowerPoint. To do that, click on the Zebra BI logo in the top-right corner, and a global toolbar will slide open. Click on the 3rd icon to open the data editor.
If you don’t want to do manual work or risk any errors, you can seamlessly link the data to your Excel files. Open the data editor and click on ‘Link to Excel’ button on the top. This will open all OneDrive/Sharepoint folders you have access to. Choose the file that contains the right data source and Zebra BI will fetch the data for you.
📖Read more detailed instructions on data linking.
By expanding the global toolbar that appears after clicking on the Zebra BI logo, you can also:
- check the design settings (1st icon),
- click on the information pane (2nd icon),
- return to ‘Chart chooser’ or ‘Table chooser’ (4th icon),
- or convert the chart type to small multiples in case you want to show the part-to-whole visualization.

📖 Learn more about data preparation in PowerPoint.
Unlock the Pro version for collaboration & sharing features
The free license of Zebra BI for Office is only meant for the personal use of one single user.
With the Pro version, you can explore further benefits, like the possibility of sharing your reports and collaborating on them with your team in real-time.
To unlock the Pro version, you can start a 14-day free trial or simply upgrade your license to either the Pro or Business plan. In any case, there are no license keys, and you will just need to sign in to your Microsoft account before you start using the add-ins.
That’s it! You’re ready to start building your reports and dashboards with Zebra BI for Office. Learn more about what types of charts and tables you can use to create reports that are actionable and understandable.