By default, Zebra BI for Office may assign the data source columns incorrectly upon visual insertion. For example, the Plan column could be assigned to the Previous Year placeholder or vice versa. The Forecast column could be incorrectly assigned to the Plan placeholder and so on. In this article, you will learn how to assign them properly with an improper assignment upon visual insertion. It is important to note that improperly assigned columns cause visual inconsistency in the International Business Communication Standards (IBCS) reporting.
Template used: Monthly variances column chart
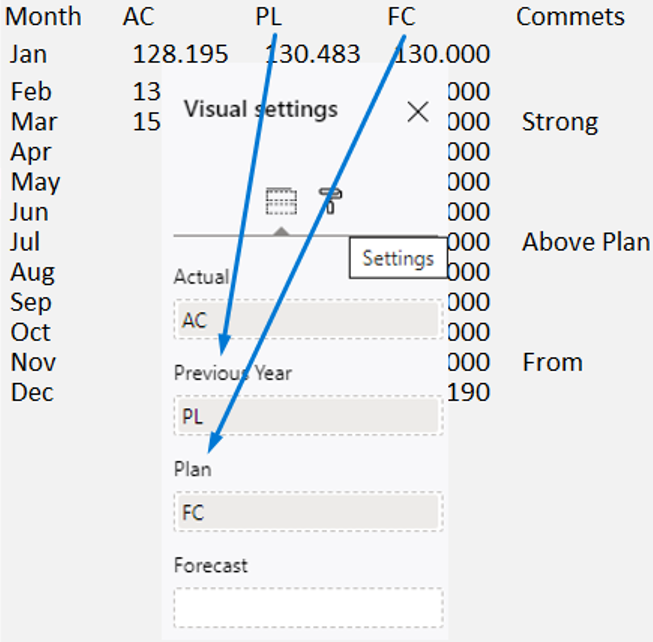
Let’s consider the dataset, an Excel range below:
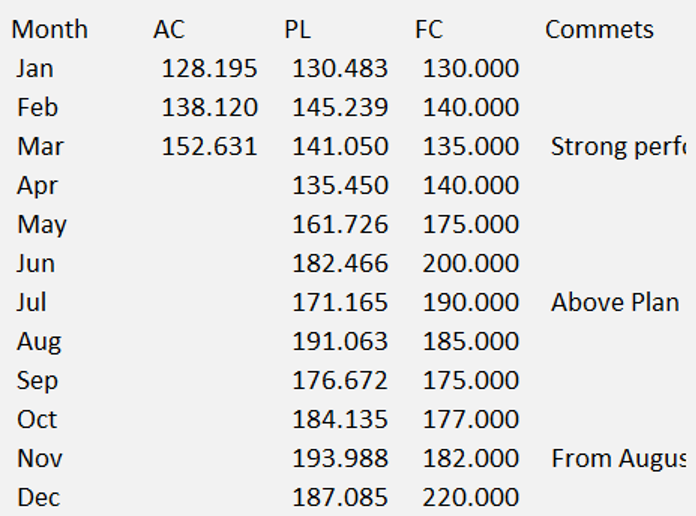
Let’s visualize it using Zebra BI for Office in Excel by applying the following steps:
Check how to import Zebra BI for Office to Excel.
- Select the data range (keyboard shortcut ctrl + A)
- Move to the Insert tab
- My Add-ins
- Select Zebra BI Charts for Office
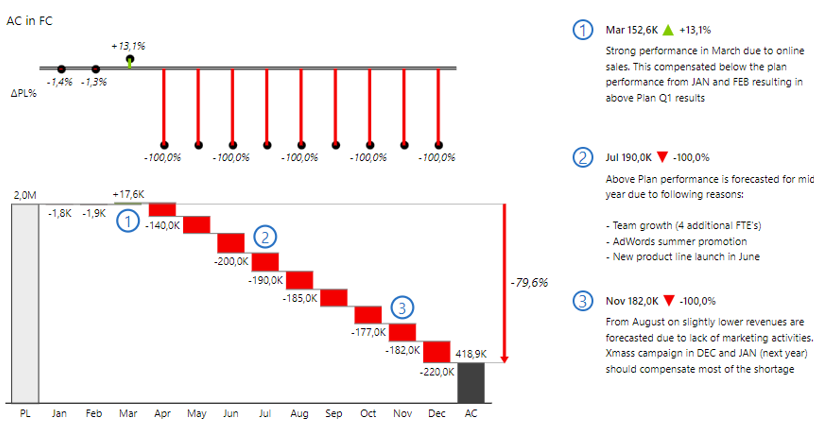
The visual assigned the source data columns by default. Let’s have a look at how it works.
Click on the Zebra BI logo on the top right-hand side.
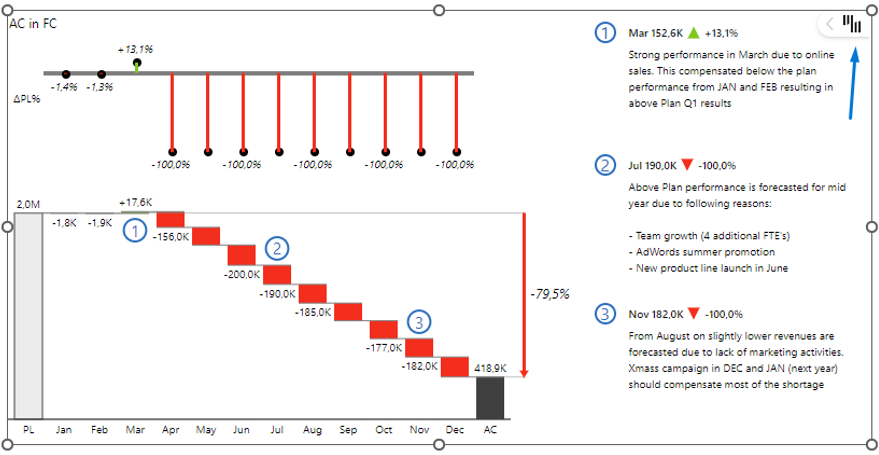
A global toolbar will slide open. Click on the ‘settings’ icon and select the first icon for field mapping.
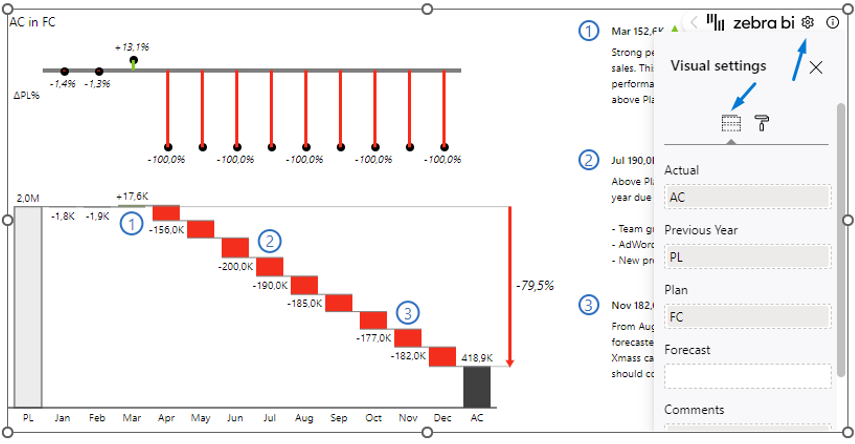
As you can see in the screenshot below, the PL value is in the Previous Year placeholder and the FC value is in the Plan placeholder. The AC value column is assigned correctly to the Actual placeholder.
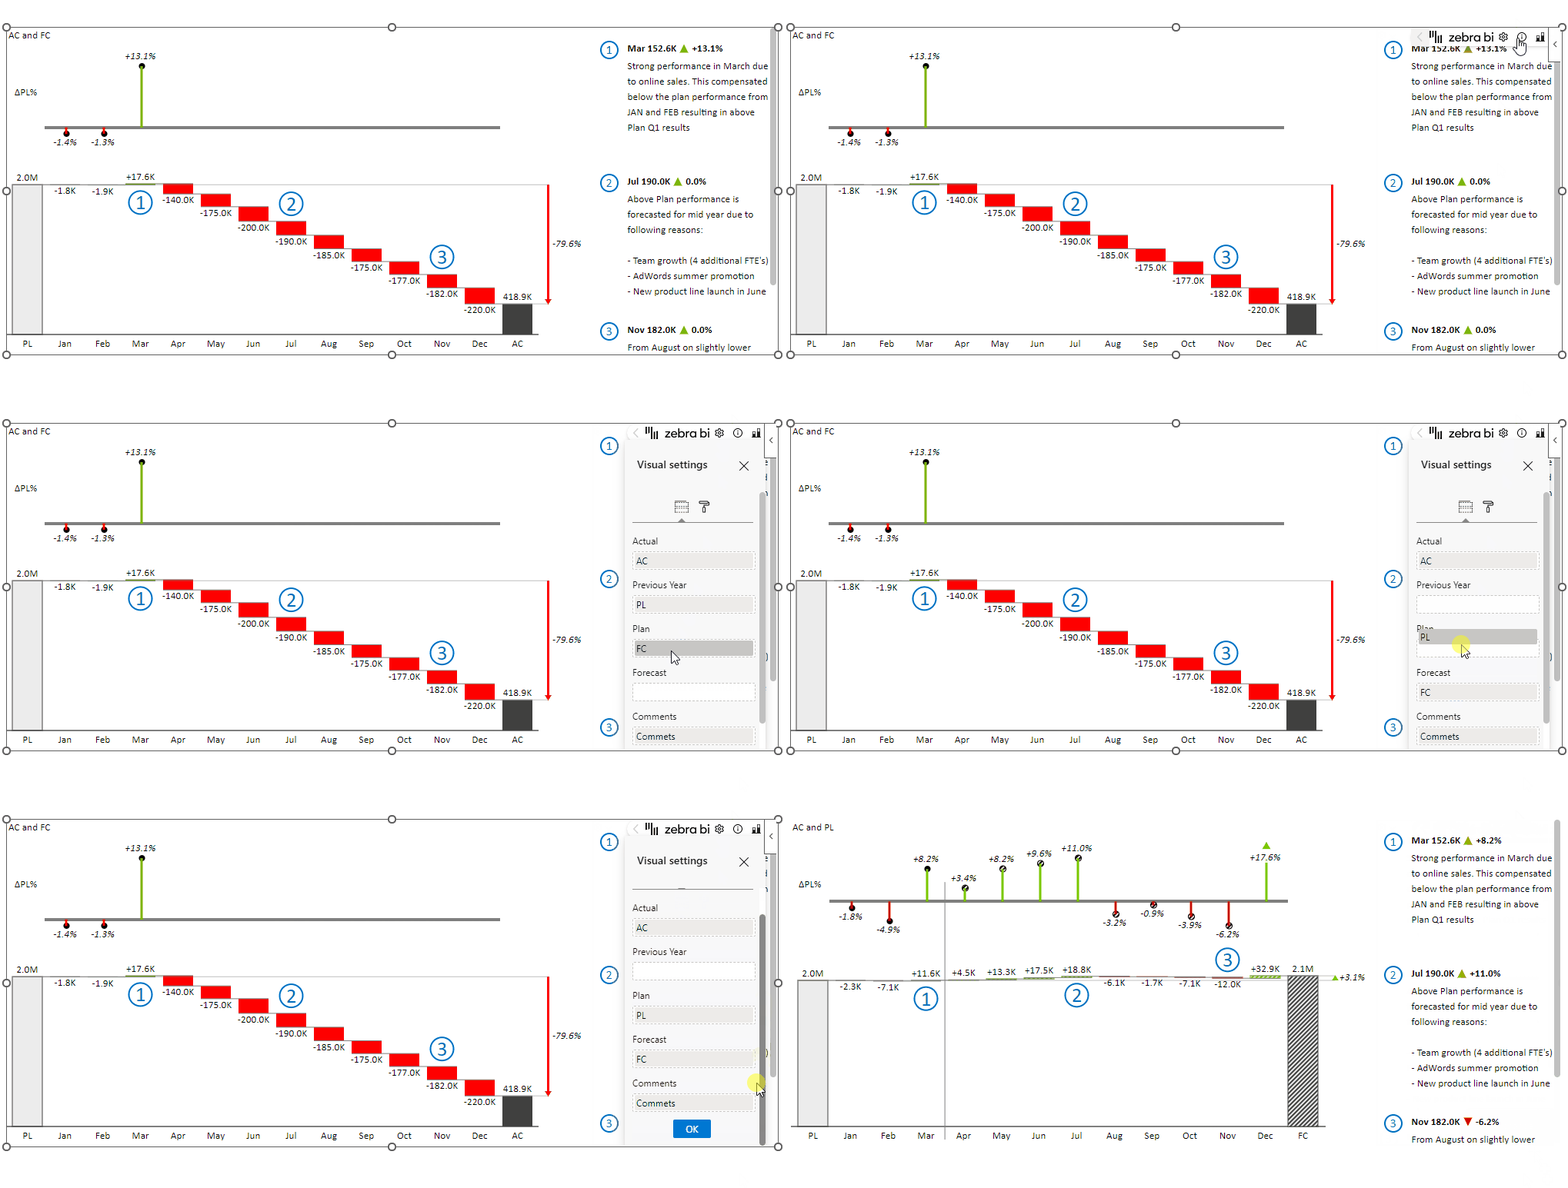
Let’s place the value columns into the placeholders correctly. Again, click on the top-right-hand side, on the Zebra Logo —> Visual settings —> Assign the columns to the visual value fields -> Click OK:
- PL value column –> Plan placeholder
- FC value column –> Forecast placeholder
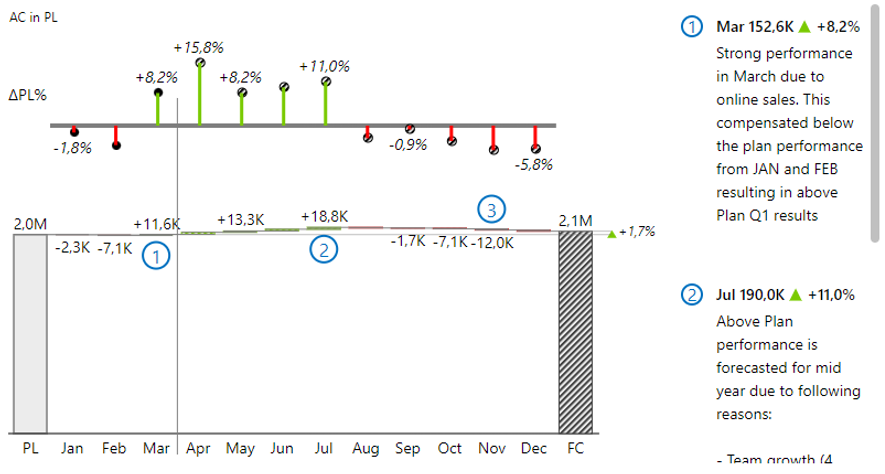
The report is looking much better with the placeholders filled in properly.
Congratulations, you’ve learned how to assign your columns to the correct placeholders. Be aware that the column assignment needs to be checked to achieve IBCS-compliant actionable reports.