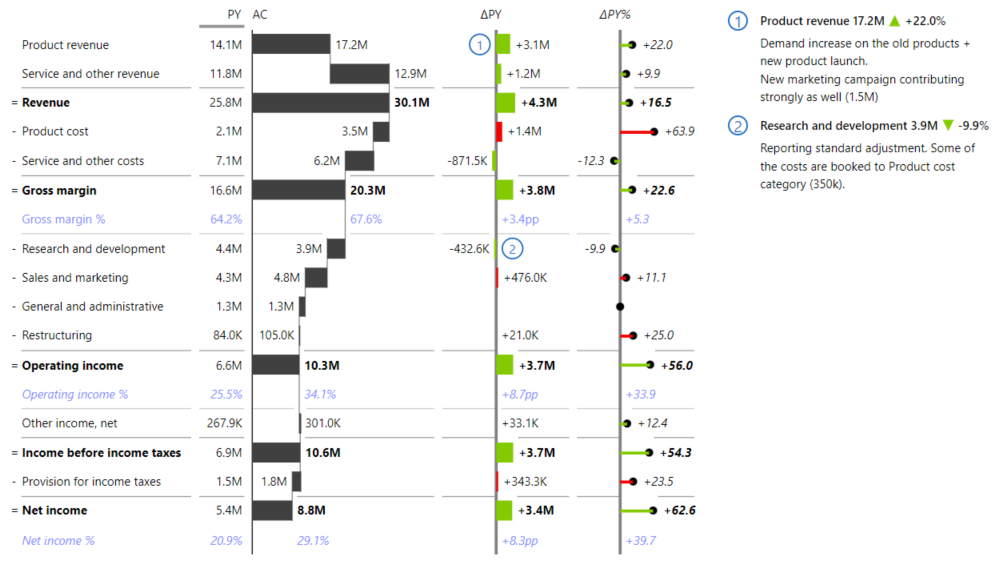
The income statement is part of every financial report but visualizing it can be tricky. With Zebra BI for Office, creating a report like the one below only takes a few steps directly in Excel.
First of all, let’s look at how the demo data is structured:
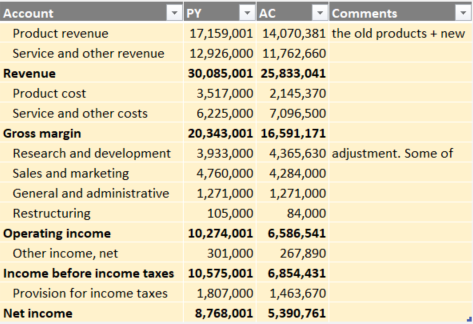
This is what’s shown per column:
- Account: This is the name of the account which will be shown in the visual. Make sure that you list the accounts in the correct sort order. For better clarity, you can make the subtotals bold and the rest of the accounts slightly indented.
- PY/AC: Values for the previous year (PY) and the current one (actuals or AC).
- Comments (optional): Here you can input your comments where necessary. They will be automatically linked to the visual.
The following steps lead to the income statement report shown at the beginning:
1. Data preparation
Prepare your data columns according to the previously mentioned data structure.
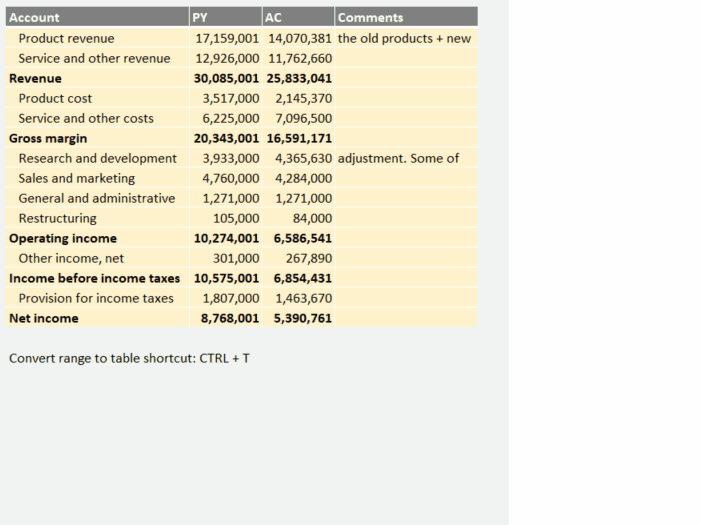
(Note: it is best practice to convert the range to an Excel table – there are several ways how to do this but the easiest is to select the cells in range and hit ‘CTRL + T’).
2. Insert the ‘Zebra BI Tables for Office’ add-in
You can do this by following the next steps:
- Click anywhere inside the table
- Move to the Home tab > Add-ins
- Select Zebra BI Tables for Office

3. Fit the visual to the available space
Resize the visual so that you see all the elements (the default layout is responsive – more on layouts). You can also resize the Comment box – by dragging & dropping the line that shows on hover between the comments and the rest of the visual.
4. Sort based on the order of accounts
The default sorting is descending by AC values but since the income statement needs to be shown in a predefined order, the logic for the sorting needs to be changed to the custom sort logic – i.e. the order in which we set the accounts in the source table (more on sorting).
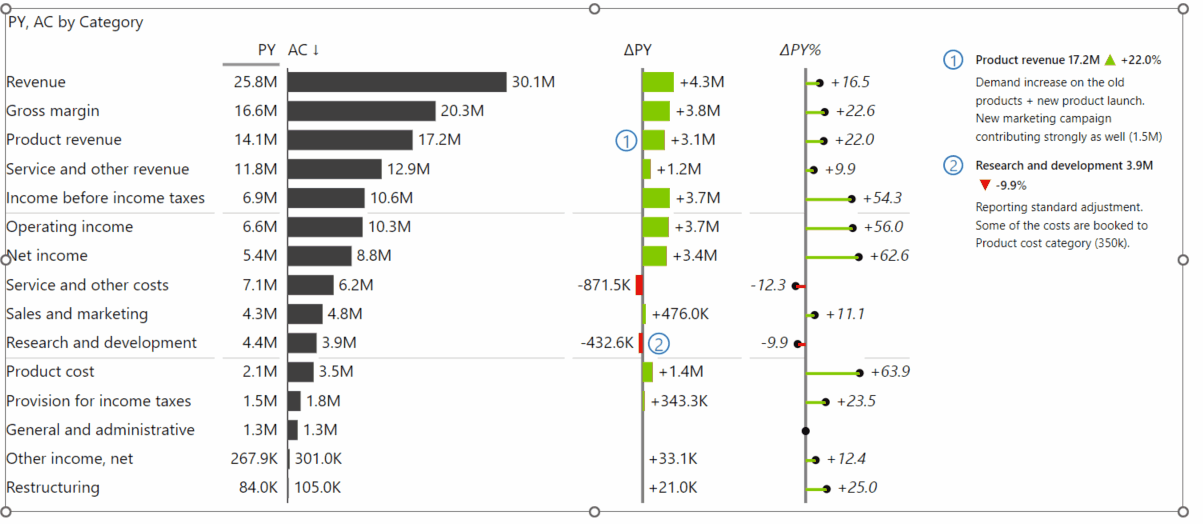
⚠️ Hint: Whenever the visual is sorted by value, this is indicated with an arrow. To change the sort order or remove the sorting by the respective value column, click on the header of the column (to switch between the options: Descending – Ascending – Custom sort by Category).
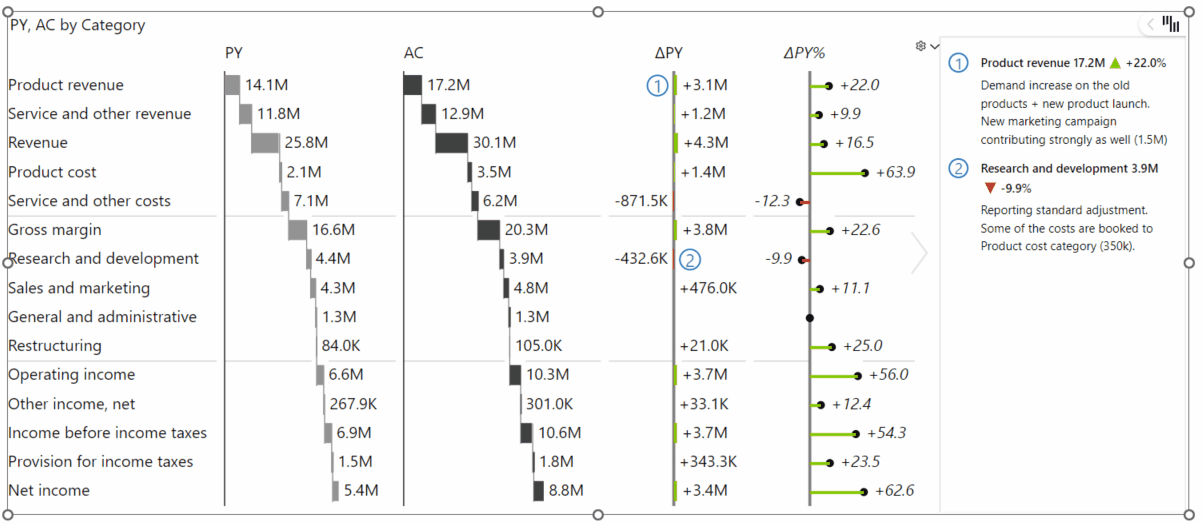
5. Change the AC (and optionally the PY) column(s) to a Waterfall chart
When you hover over the header of a column, a little black arrow will show. Clicking this arrow will bring up a dropdown menu that allows you to change some settings of the respective column. Select the symbol for the waterfall chart to change the style of the column.
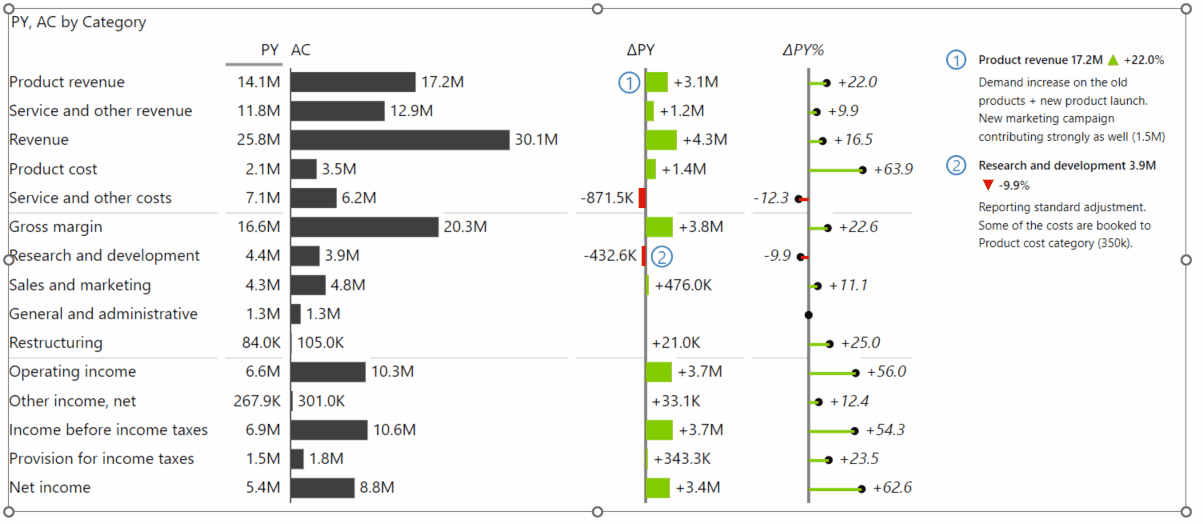
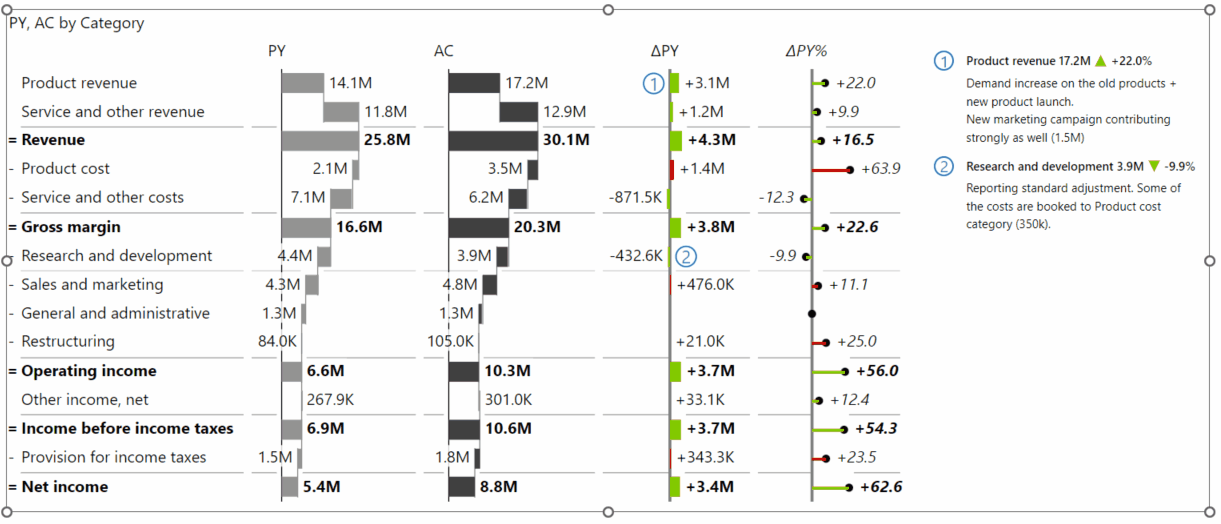
6. Choose between 3 different account types in an income statement
There can be 3 different account types in an income statement.
Income (positive values), Costs/Expenses (negative values) and totals. In the Zebra BI Tables add-in, the default is an income account so for all rows which are totals or negative accounts the setting needs to be adjusted. To do that, right-click on the respective account and select Invert (for negative accounts) or Result (for totals).
7. Add custom rows with the formula editor
If you wish to add custom formula rows without adding them to your source or adding them at the source is not an option, you can always use the formula editor to add additional rows with custom formats on the visual directly (more on formula editor).
⚠️ Hint: It is helpful to color code the custom rows (but avoid the colors used for variances) to distinguish them from the rest. Nevertheless, you can always see which rows are custom in the ‘Manage formulas’ which shows up in the formula editor once you have multiple such rows.
You now have an income statement created with Zebra BI Tables for Office.
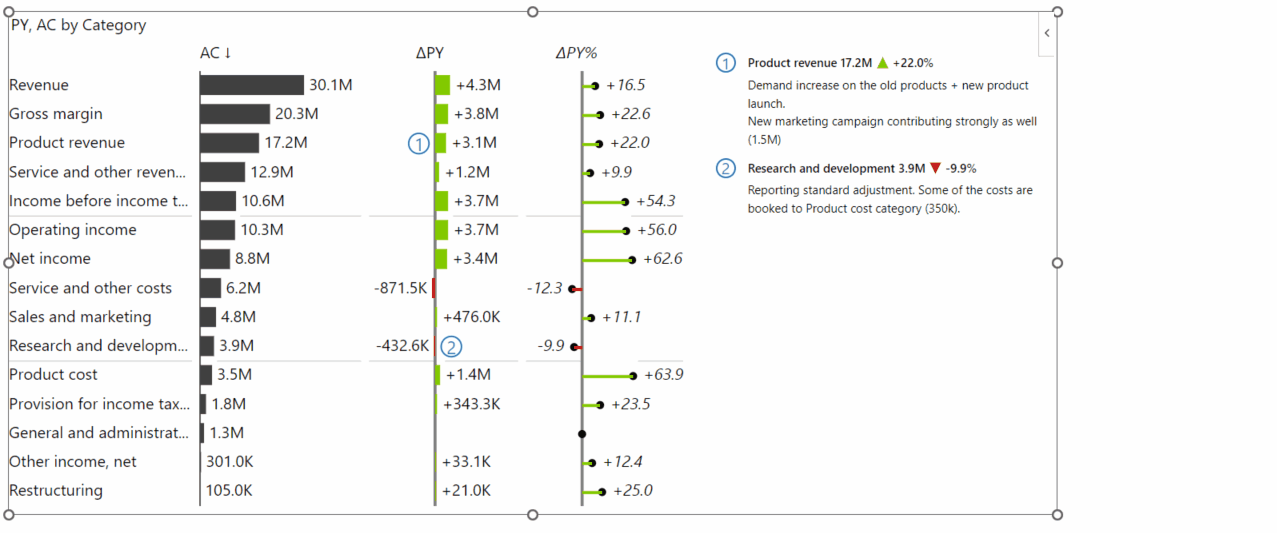
It is also possible to expand/collapse the account structure so the report looks like the one shown below.
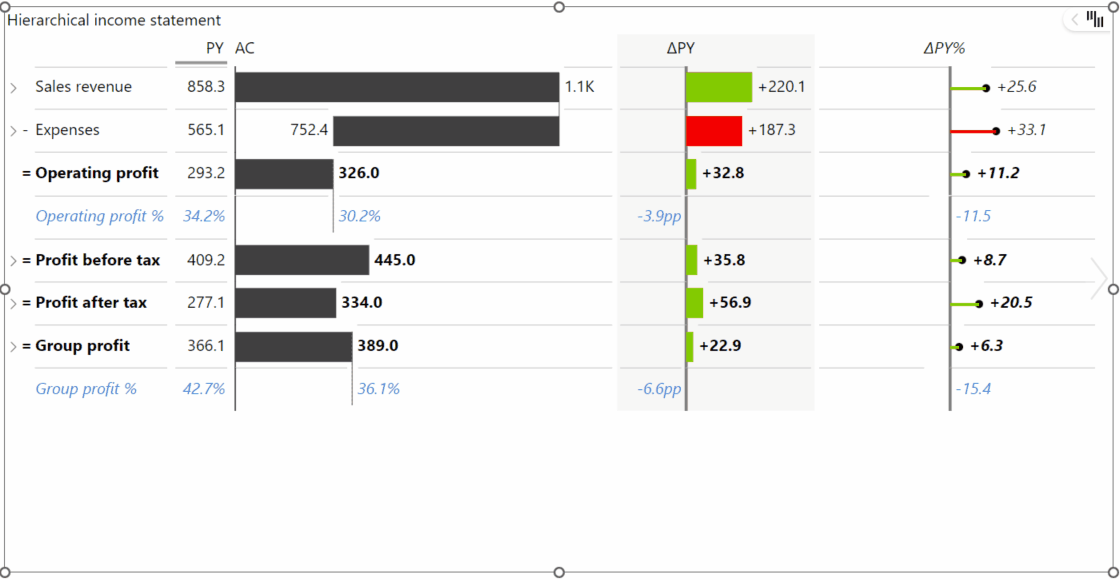
To use this feature, you need a multi-level Zebra BI Table. Learn how to create one by following the linked article.
Congratulations! You’ve just learned something essential for every financial report. Surely, the end-users will be delighted to see an actionable income statement in Excel.