To get a multi-level table we need three things:
- Zebra BI Tables for Office add-in
- A pivot table as the visual source
- Pivot table Tabular form layout (applied upon visual insertion automatically)
Template used: Income statement – multi-level table.xlsx
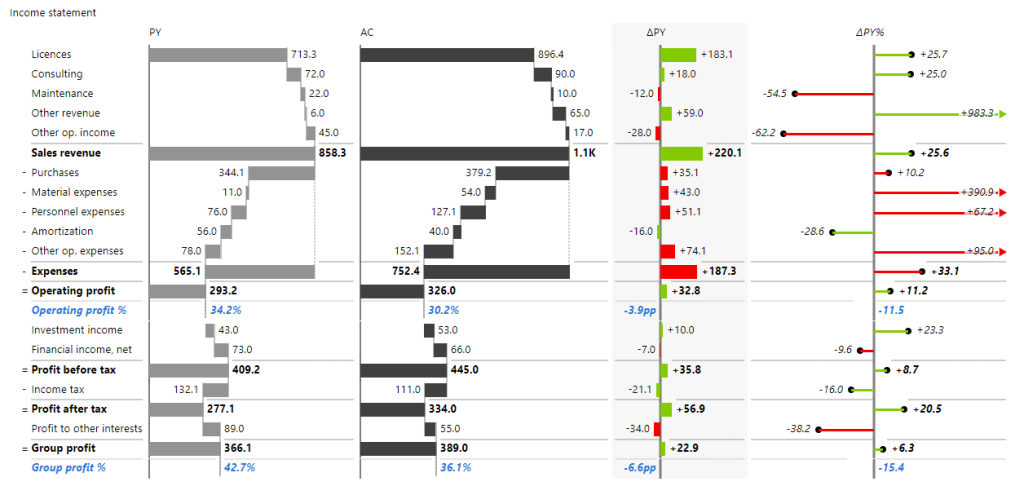
We will look at a typical example used in the Income statement creation article, multi-level tables using Zebra BI Tables for Office add-in in Excel.
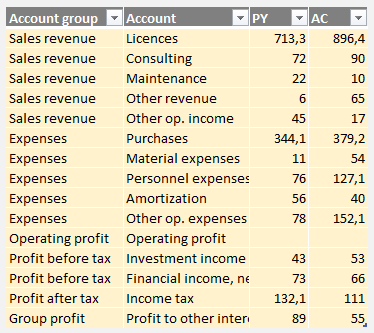
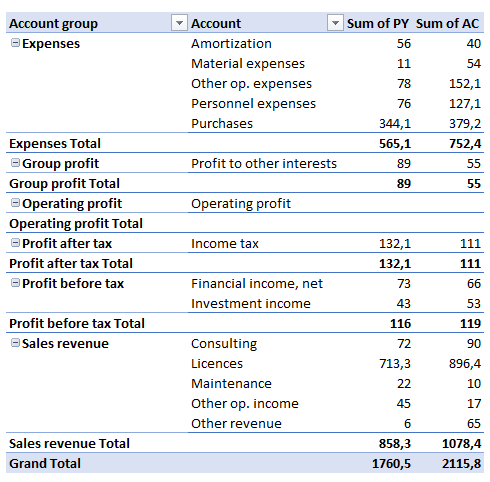
Below, we have Income statement data formatted as an Excel table. Notice that we have two levels of accounts, Account group and Account. Let us show you how to prepare your visual source data properly for a multi-level table in the Zebra BI Tables for Office add-in.
First, let’s create a pivot table out of this data. We will use it as a visual source.
Most of the pivot tables are usually set by default to the Compact Layout.
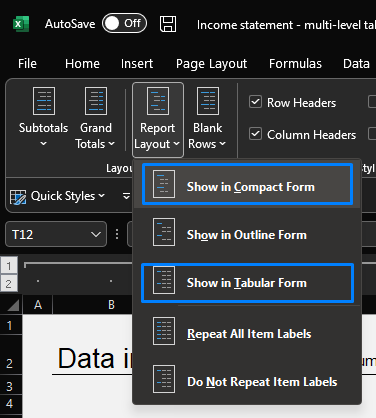
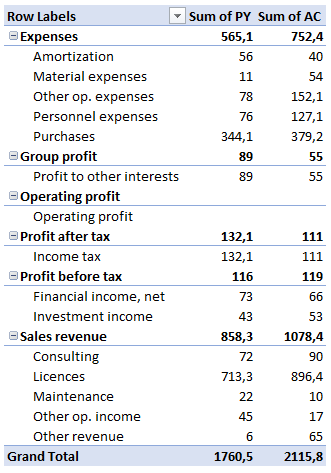
The pivot table changes to the Tabular form Layout upon insertion:
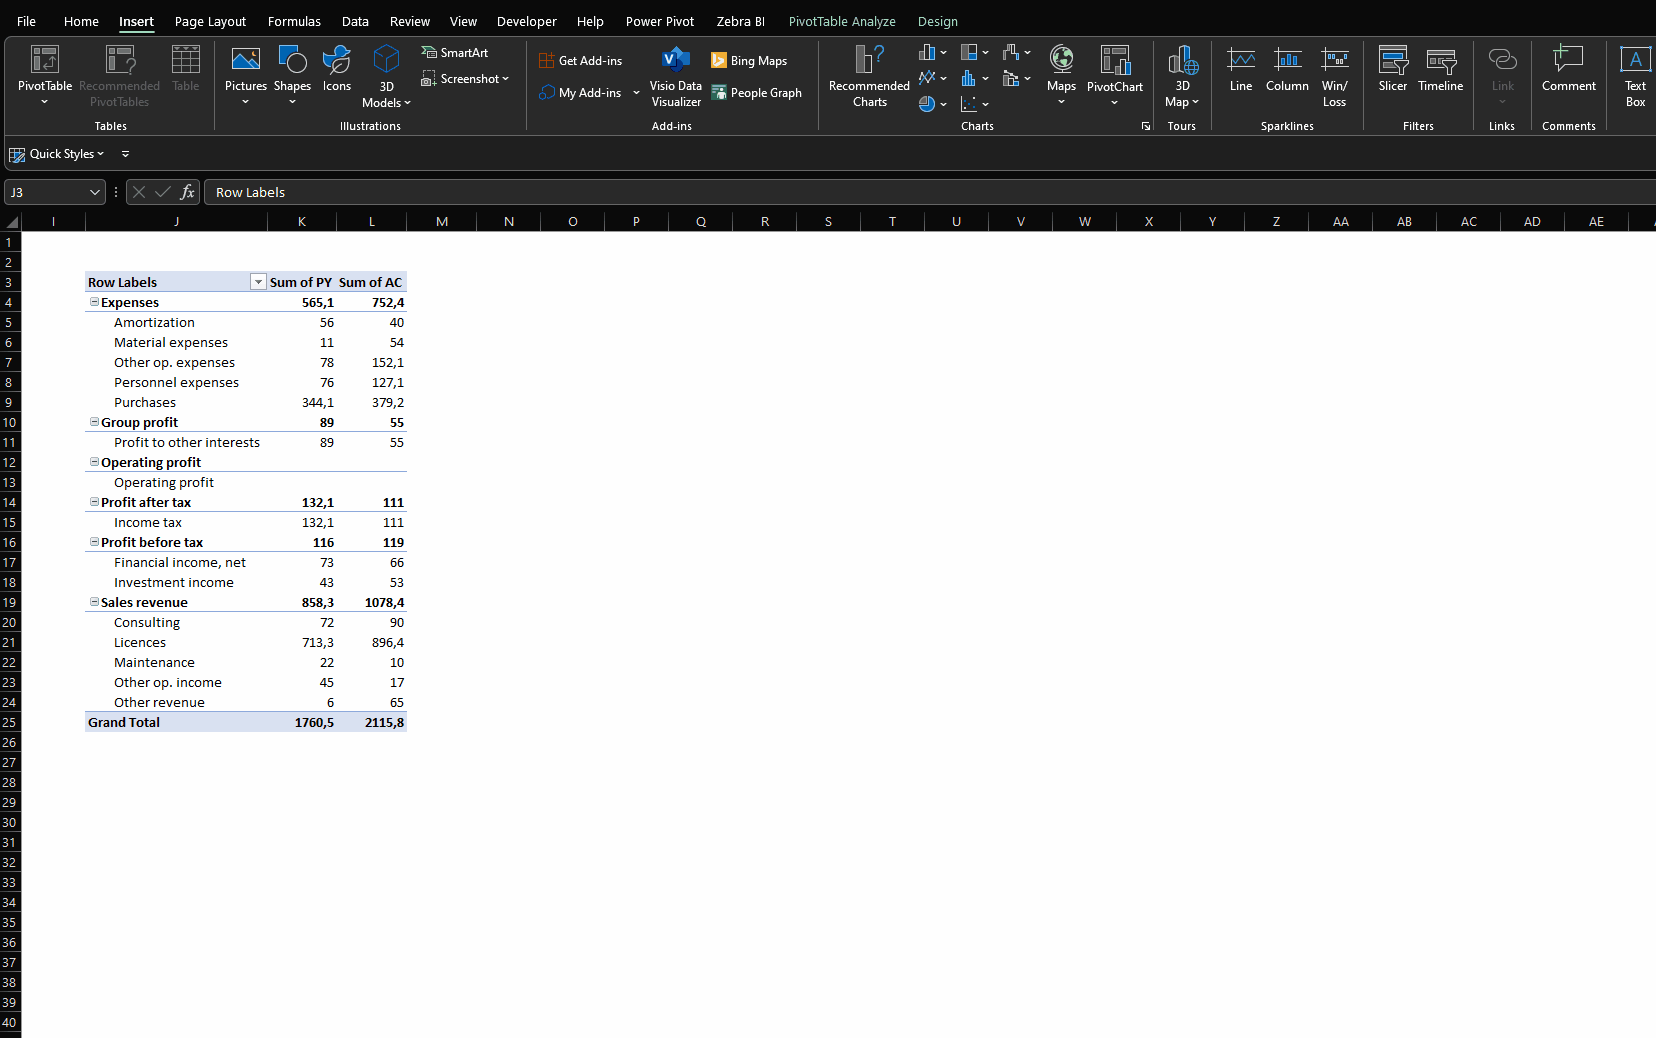
This is what the pivot table Tabular form Layout looks like:
To check how to create the multi-level Income statement, check the following article: Income statement in Excel
In summary, pivot tables have multiple layout options. The one we are using for our visuals, and recommend is the Tabular form. It is important to note that this happens automatically upon visual insertion.