Small multiples are one of the most powerful data visualization methods that can vastly increase the depth of insight into your reports and dashboards. The Zebra BI Charts for Office add-in provides extensive support for small multiples. This will help you display extremely valuable visual comparisons on every single report page.
Introduction to small multiples
You can create small multiples with any Zebra BI chart. It can be done by using a Pivot table as a data source. To get a small multiples display, you will need to create your primary table with two categorical columns, one for trends and one for grouping, and at least one value column. Create a Pivot table by placing your Group column into Columns, Month column into Rows, and actual/previous year/plan (AC/PY/PL) columns into Values.
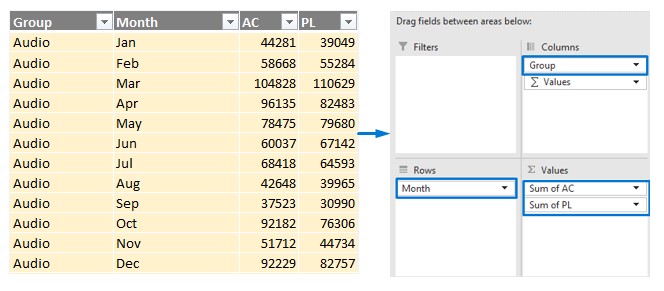
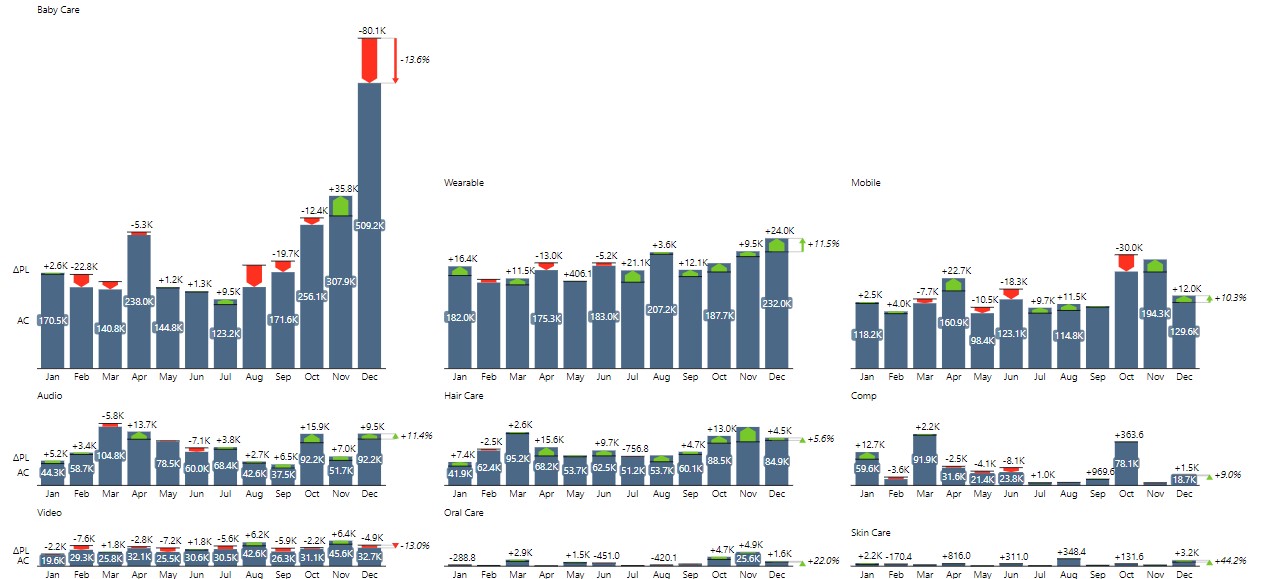
Once you have your data formed properly, Zebra BI will recognize the data and create a small multiple visual. Row entries will fill the horizontal axis and columns will separate values on individual charts.
You will notice that all the charts are scaled (rendered to the same scale, or in other words, the Y-axis is automatically synchronized across all the charts). This is extremely important because only properly scaled charts enable real visual comparisons between data categories. But no need to worry, Zebra BI takes care of this out of the box.
Once you’ve created your small multiples, you can change any setting on any chart and the change will be instantly applied to all the charts at once. For example, you can break the axis or change the chart type.
By visually comparing data categories rendered in a small multiple, the user will understand the importance of each category. Some data categories have smaller values; consequently, the chart representing it will be smaller as well. You can zoom into a selected category by clicking on the title above each chart. A separate pop-up window will open so you can observe the details on that individual card. When done, simply click on the X icon in the pop-up window.
Displaying multiple charts in one single visual as opposed to simply putting several unrelated visuals on your report page has many advantages. Apart from proper visual display due to correct scaling, this method requires significantly less work on your part.
Highlighting small multiples
Small multiples also have the option of highlighting single small-multiple series with specific colors. This way, you can make the most relevant group of data stand out even more clearly.
Right-click on the Group title and select to highlight an entire series of small multiples. Try highlighting all the relevant series with different colors to make sure your reports are as insightful as possible.

Invert a group
Sometimes your outliers need to be presented in the opposite way. That’s why we implemented the option of inverting the specific series by right-clicking on the Group title and marking the Invert option. This will switch your increases to red (as bad) and decreases to green (as good).
Congratulations! You successfully created your small multiples report with Zebra BI Charts for Office directly in your Excel.