Business reports should not look like a long phone-book-style list of items. Rather, they should quickly expose the most important data elements, topmost important variances, etc. That is why Zebra BI for Office in Excel offers practical functions for displaying Top and/or Bottom N elements that will make your reports and dashboards much more focused and actionable.
In Zebra BI Tables for Office, you can use it to display the Top 10 or Top 20 most important elements in your rows (either by value or by the variance), for example, while all other small elements are automatically summed up into a new row called Others. Here’s a classic example:
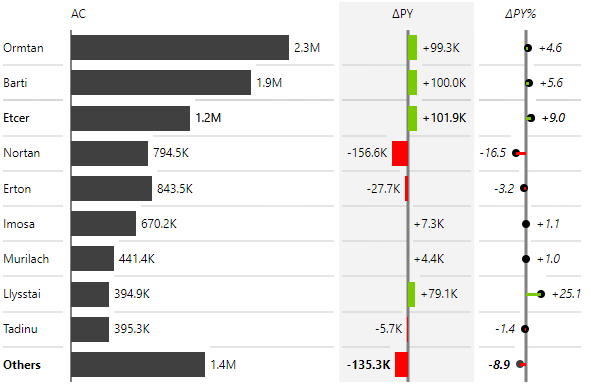
Top N + Others in Zebra BI Tables for Office
To turn on Top N + Others in Zebra BI Tables for Office, right-click on your data categories, and select Top/Bottom N from the context menu:
On top of filtering out the top elements, the Zebra BI Tables add-in will also automatically calculate and display the Others row.
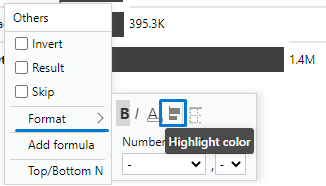
You can further highlight the Others row by right-clicking on the Others element name, expanding the Format section, and choosing the Highlight color option:
Every user can quickly change the number of top elements displayed by simply clicking on the up/down button next to Others:
You can set the filter to Top N elements, Bottom N elements, and also Top & Bottom elements. Similarly, you can choose to filter by value (e.g. actual sales), absolute difference, or relative difference:
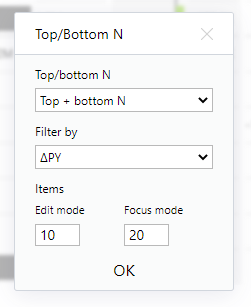
A very interesting and useful option in business reporting is to filter by the most important variances (either positive or negative). You can achieve this by setting the filter to Top + bottom N and filter by Absolute variance:
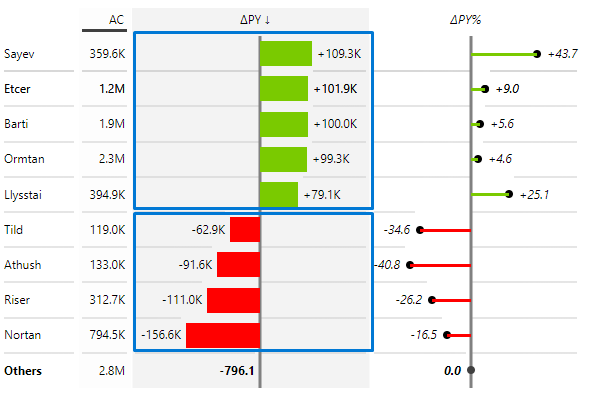
This will effectively expose the most important variances in your data that have contributed either positively or negatively to the total variance.
Applying Top N in hierarchical tables
If you have a hierarchical table (two or more data fields in rows), then you can enable the Top N feature on a selected level in your hierarchy (specific data field in your categories) or even turn Top N on several data fields at once!
In the following example, the Zebra BI Tables add-in contains two data fields (Continent and Market) and both have the Top N filter turned on. This table shows the Top 2 continents (+ others) and then Top 3 markets within that continent (+ others):
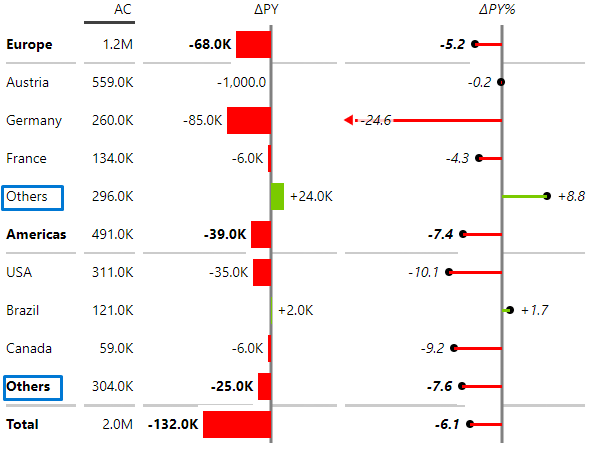
To achieve that, simply right-click on any element of the data field that you want to filter, e.g. on a market name to set the Top N filter by the market or on a continent name to set the Top N by continent.