To start creating stunning reports with the Zebra BI add-in for Office in Excel, you just need to import them from the Microsoft AppSource into your Excel: online or desktop.
Import visuals from Microsoft AppSource
Excel desktop
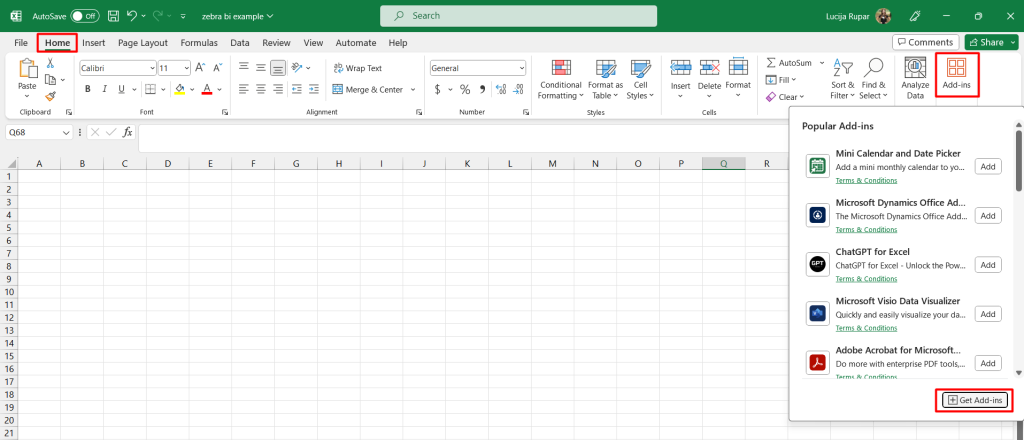
In your Excel, go to Home> Add-ins. Click on the button at the bottom: Get add-ins.
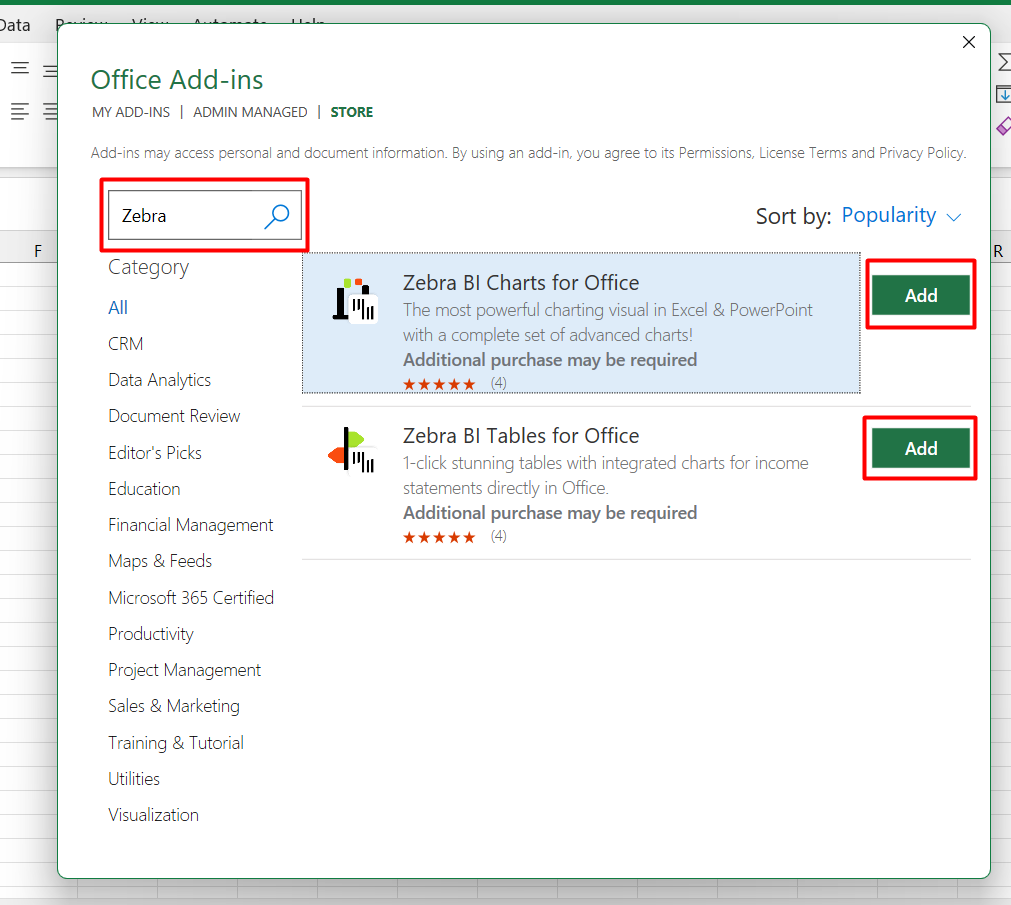
Search for ”Zebra” in the AppSource to find Zebra BI Tables for Office and Zebra BI Charts for Office. Click on the Add button.
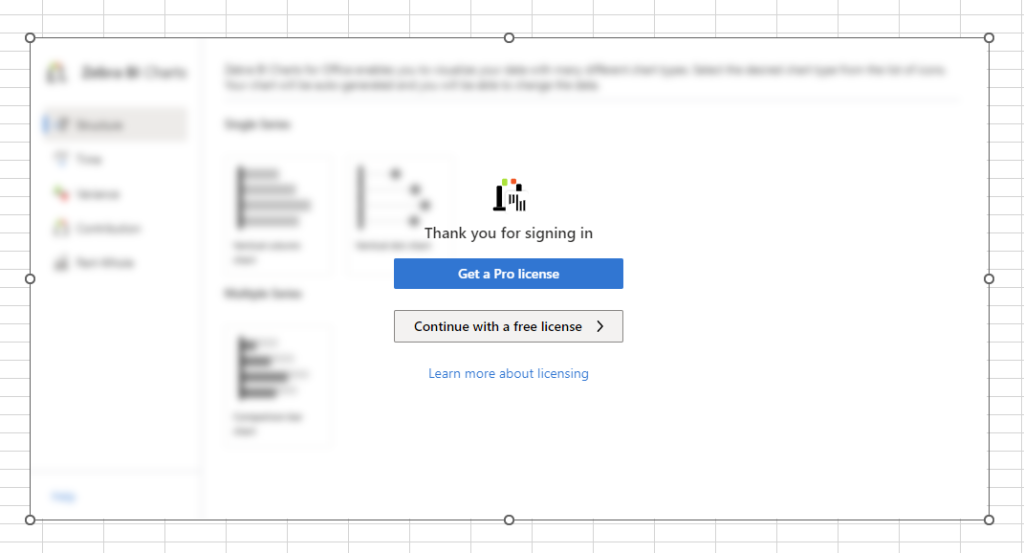
After you click on the Add button, you will need to agree to the add-in’s license terms & privacy policy. After clicking Continue, the add-ins will open automatically. If you have a free license, choose the option ‘Continue with a free license’. If you have a paid license, you will not see this screen.
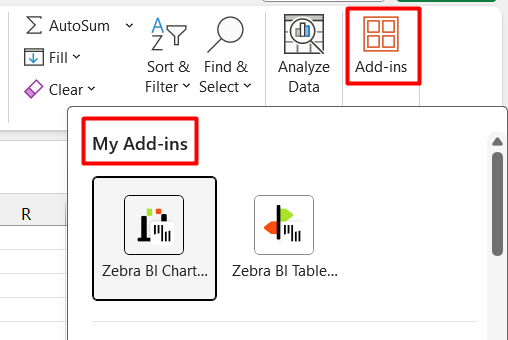
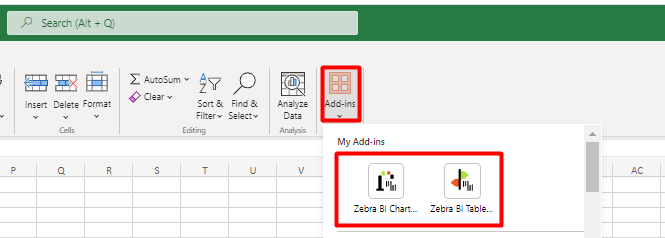
The next time you want to start using the add-ins, simply click on Add-ins under the Home tab. If you previously used Zebra BI Charts and Zebra BI Tables, they will both be listed under My add-ins.
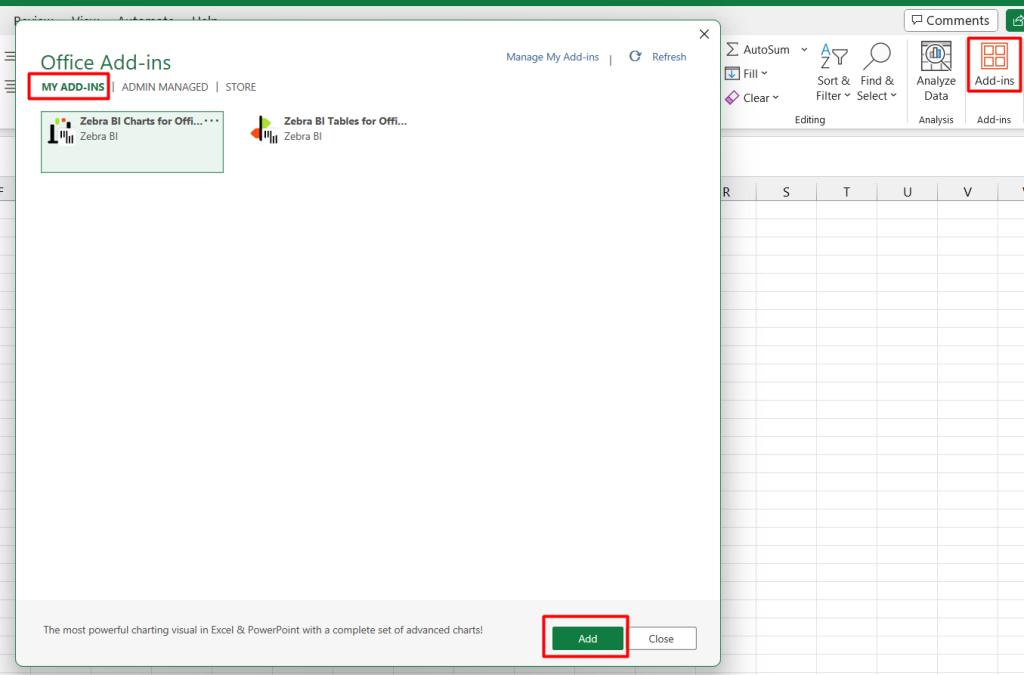
If you don’t see the add-in(s) here, click again on Get Add-ins. Once the store pop-up opens, click on the My Add-ins tab. Select the add-in you want to insert and click Add.
Excel online
If you want to use Zebra BI for Office in the online environment, the steps are very similar to the ones described above.
In your Excel, click on Add-ins under the Home tab > Click on Get more Add-ins. Search for ”Zebra” in the AppSource to find Zebra BI Tables for Office and Zebra BI Charts for Office. Click on the Add button.
After you click on the Add button, you will need to agree to the add-in’s license terms & privacy policy. After clicking Continue, the add-ins will open automatically. If you have a free license, choose the option ‘Continue with a free license’. If you have a paid license, you will not see this screen.
The next time you want to start using the add-ins, simply click on Add-ins under the Home tab. If you previously used Zebra BI Charts and Zebra BI Tables, they will both be listed under My add-ins.
If you don’t see the add-in(s) here, click again on Get Add-ins. Once the store pop-up opens, click on the My Add-ins tab. Select the add-in you want to insert and click Add.
Start using the add-ins
After you import the add-ins, they will automatically open the so-called ‘chart chooser’ or ‘table chooser’ (depending on which add-in you insert). You can choose from different layout options for charts & tables. When you select one, the add-in will visualize it for you based on some dummy data.
Chart or table choosers are a great way to start exploring the add-in. However, to create your own reports, you need to insert your data. Follow the steps below.
Add your own data
In Excel, there are 3 ways in which you can prepare your data to start using the Zebra BI for Office add-ins.
You can put data into a simple cell range, a pivot table, or an Excel table. Whatever you choose, simply click on one of the data entries and go to Home > My Add-ins and select either Zebra BI Charts or Zebra BI Tables for Office.
📖 Learn more about data preparation in Excel.
Adjust settings on the add-in
The Zebra BI logo will show up in the top-right corner. If you click on it, it will slide out and you’ll be able to see the settings & information icon.
By clicking on the settings icon, you will have an option to adjust the field mapping or set different visual settings by clicking on the paint icon. You can define the layout, font settings, units, display of the comment box, decimal places, etc.
That’s it! You’re ready to start building your reports and dashboards with Zebra BI for Office. Learn more about what types of charts and tables you can use to create reports that are actionable and understandable.