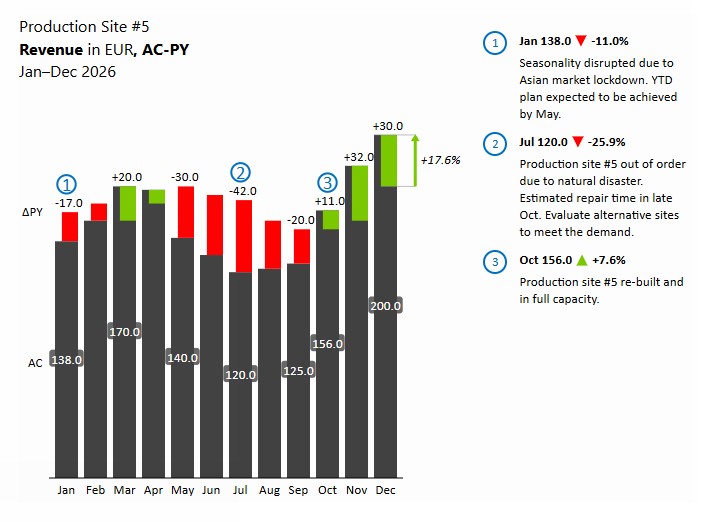
Zebra BI Charts support rich title formatting, allowing you to distinguish categories and establish a clear structure. Emphasizing key information with bold formatting improves readability and helps users quickly identify what matters most.
How to format a title
- Enter the title editing mode by hovering over the title and clicking inside the blue rectangle. The formatting menu will appear.
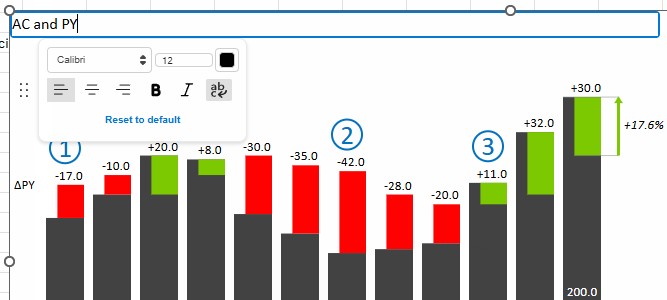
2. Insert line breaks: start typing in the content, then press Enter to move to a new row. Confirm the content by clicking outside the title box.
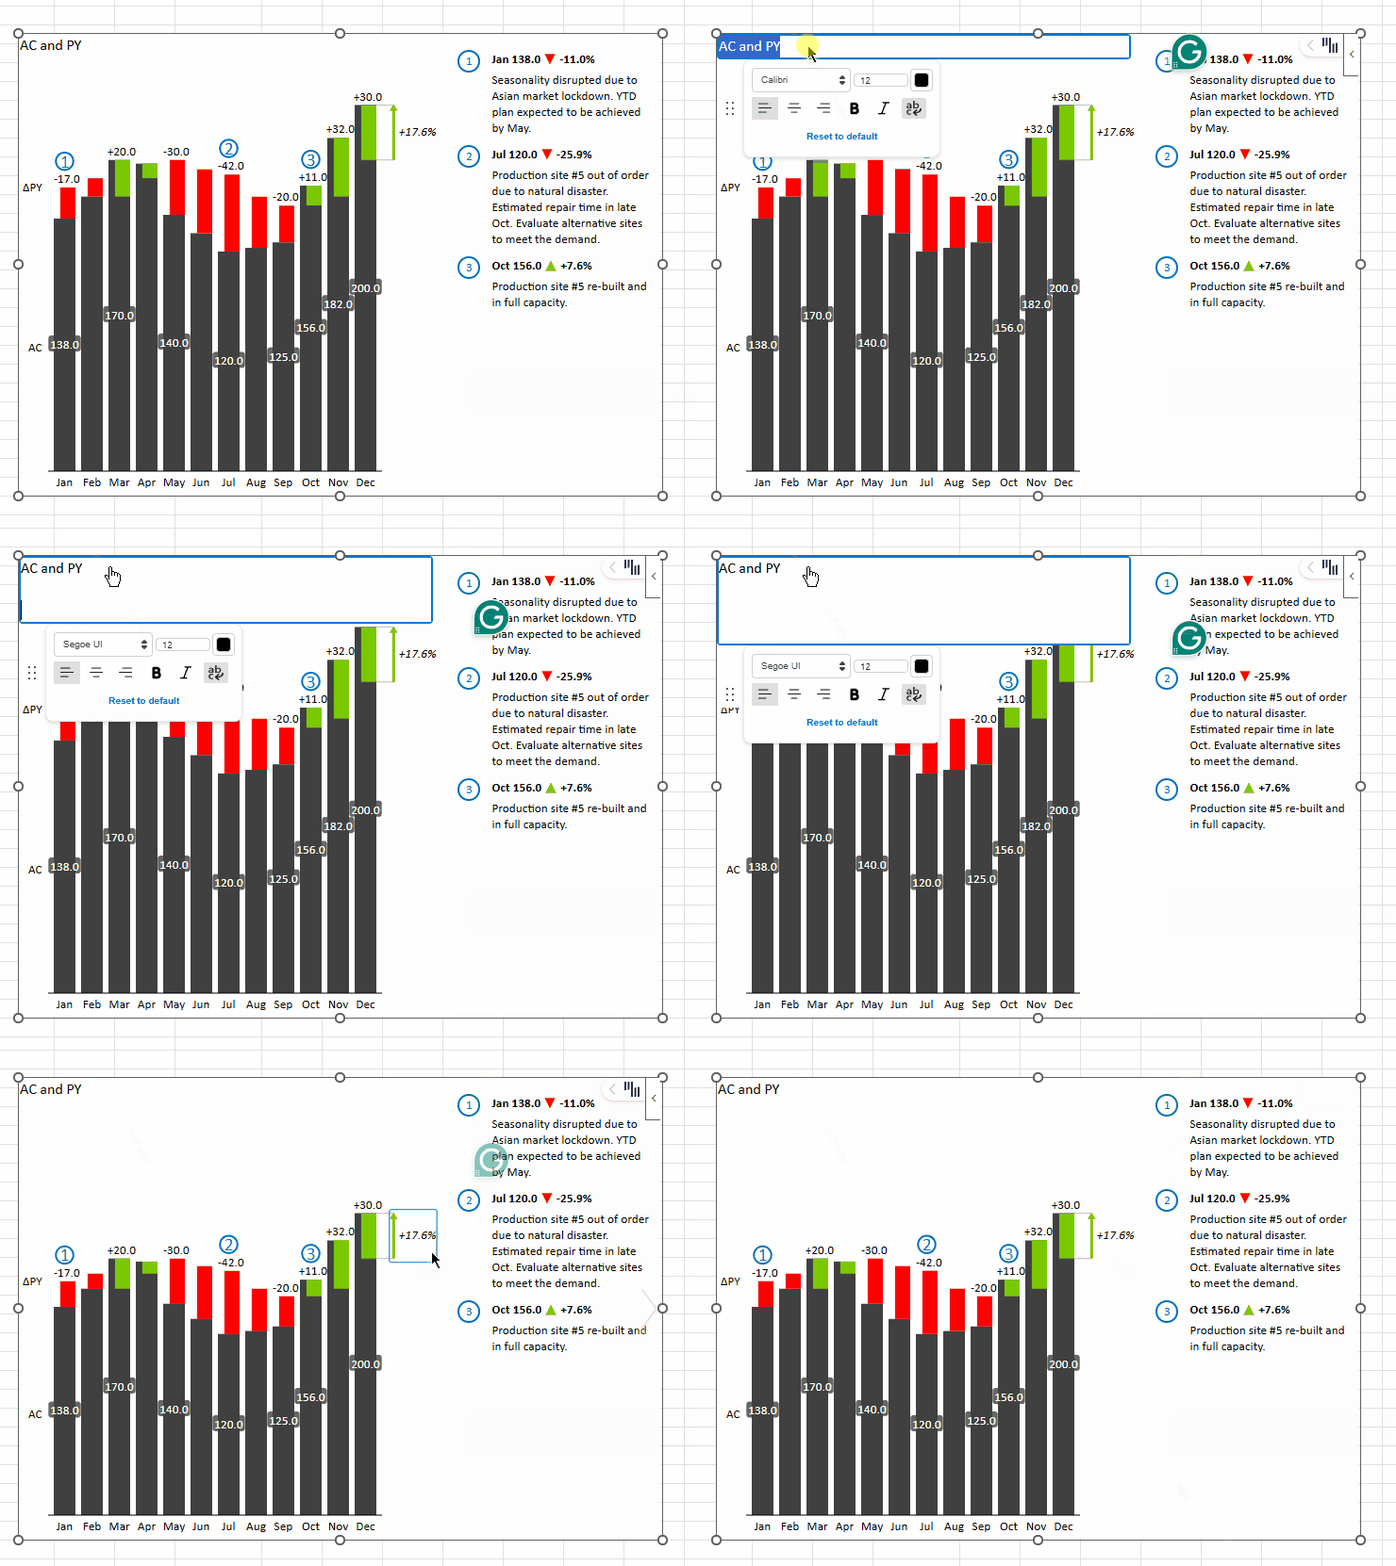
3. Format the content as needed. Keep the structure clean and avoid visual overload. Use bold only to emphasize key information that should immediately attract attention.
Tip 💡
Well-structured line breaks reflect structured thinking. A clearly organized title improves readability, visual hierarchy, and quick identification of key elements.
IBCS Recommendations
According to IBCS (International Business Communication Standards), titles should be structured into three components (rows):
- Reporting unit – Who
- Measure – What
- Time / Scenario – When
This order follows how users cognitively process information:
- Context (entity)
- Content (measure)
- Timeframe (period)
Using a consistent structure:
✅Makes titles functional rather than purely aesthetic
✅Speeds up scanning
✅Improves consistency across reports