Annotation layer
The day is here when the highly anticipated annotation layer finally lands in your lap! The annotation layer is a new set of features that enables you to add context to your charts and tell a story about your data.
Hover over the visual, where the icons at the top right appear:
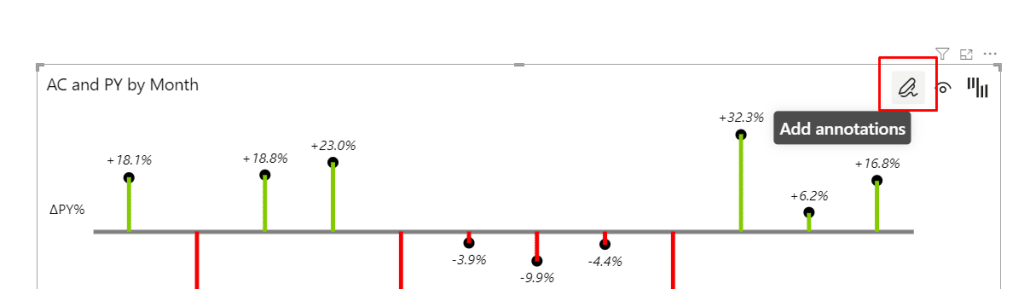
You can drag the icon menu to a different position if it’s obstructing some other settings within the visual. The menu will auto-reposition to the original position once the visual is refreshed.
The first feature to land in the Charts annotation layer is the quick commenting feature, which allows you to add comments on charts on the fly, without the need to meddle with the data model. You can simply select the category on the chart and type the comment in directly, no fuss.
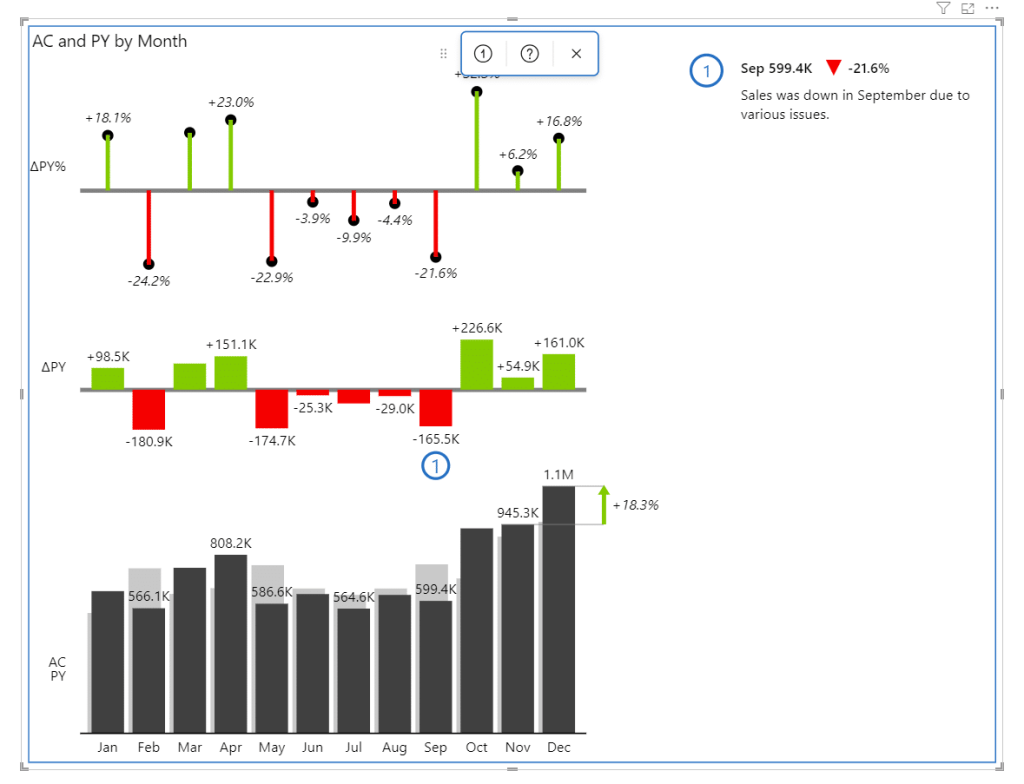
You can then further edit and delete the comments.

Keep in mind that the comments are saved within the visual and are not persisted back in the data model (in other words, no write-back to the data model). This is because we wanted to keep our visuals certified and thus we are not permitted to perform write-back.To enter the annotation layer, click on the icon in the top right corner. Then you can select the commenting icon, place it on the visual, type in your comment, and save it. Voila, you have added your first comment.
Setting up the filter context
Naturally, you’re often using slicers, filters, and other visuals to filter the contents of the charts visual and you want the annotations to respond to your filtered state. Due to restrictions in Power BI, you need to provide the Charts visual with the data that is filtering it. You can do so by adding the fields and measures that you want your annotations to respond to, to the dedicated “Filters” bucket:
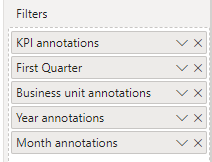
For example, if you are using a slicer to select KPIs and you want the comments on the charts visual to be associated with each selected KPI, you add the “KPI annotations” measure to the “Filters” bucket.
Here is an example of such a measure:
KPI annotations = SELECTEDVALUE(KPIs[KPI])You can also do the same with dimension fields (attributes), for example, just drag the “Quarters” into the “Filters” bucket. This will create an implicit measure (“First Quarter”).
Important:
– This will not work if you are using Calculation groups (see: MSFT documentation on Calculation group limitations).
– Implicit measures will allow you to cover single filter selections. For more intricate filtering (multiple selections), you will have to use explicit measures.
Here is an example of a multiple-selection explicit DAX measure.
Quarter annotations =

// Multiple selection option
VAR Quarter_ =
    CONCATENATEX ( ALLSELECTED ( 'Calendar'[Quarter] ), 'Calendar'[Quarter], ", " )
RETURN
    IF ( NOT ( ISFILTERED ( 'Calendar'[Quarter] ) ), "All Quarters", Quarter_ )
The above measure can also be used for calling out multiple values for Dynamic titles in Zebra BI.
For only single selection =
SELECTEDVALUE('Calendar'[Quarter])
⚠️Since filter context requires a measure, either implicit or explicit, it applies to all records within the dimension added to the visual. This means that if the measure is not defined to return blank for records without values, those records may still appear as empty rows in tables or empty columns in charts.
To address this behavior, we recommend the following approach:
IF ( ISBLANK ( [AC] ), BLANK (), SELECTEDVALUE ( 'Calendar'[Quarter] ) )Once you add the desired fields you can display the right annotations for each slicer selection:
Let us know how you like the feature and what improvements you would like to see in the future!