Basis points are a common unit for measuring interest rates and other percentages in finance. They are mostly used in big companies where margins don’t grow by many percents, but rather by fractions of a percent.
Learn how you can apply basis points to visualize the absolute variances with Zebra BI Tables and convey the right message to your audience.
⚠ Note: this feature is available with the 6.1 update of the Zebra BI Tables visual.
One basis point is equal to 1/100th of 1%, or 0.01%, or 0.0001, and is used to denote the percentage change in a financial instrument. The relationship between percentage changes and basis points can be summarized as follows: 1% change = 100 basis points and 0.01% = 1 basis point.
It is much easier and clearer to say, that the operating margin grew by 30 basis points than to say it grew by 0.3% which in big companies can represent a huge number (in millions).
If you want to display your variances with basis points, you can find a step-by-step guide on how to do that in the article below.
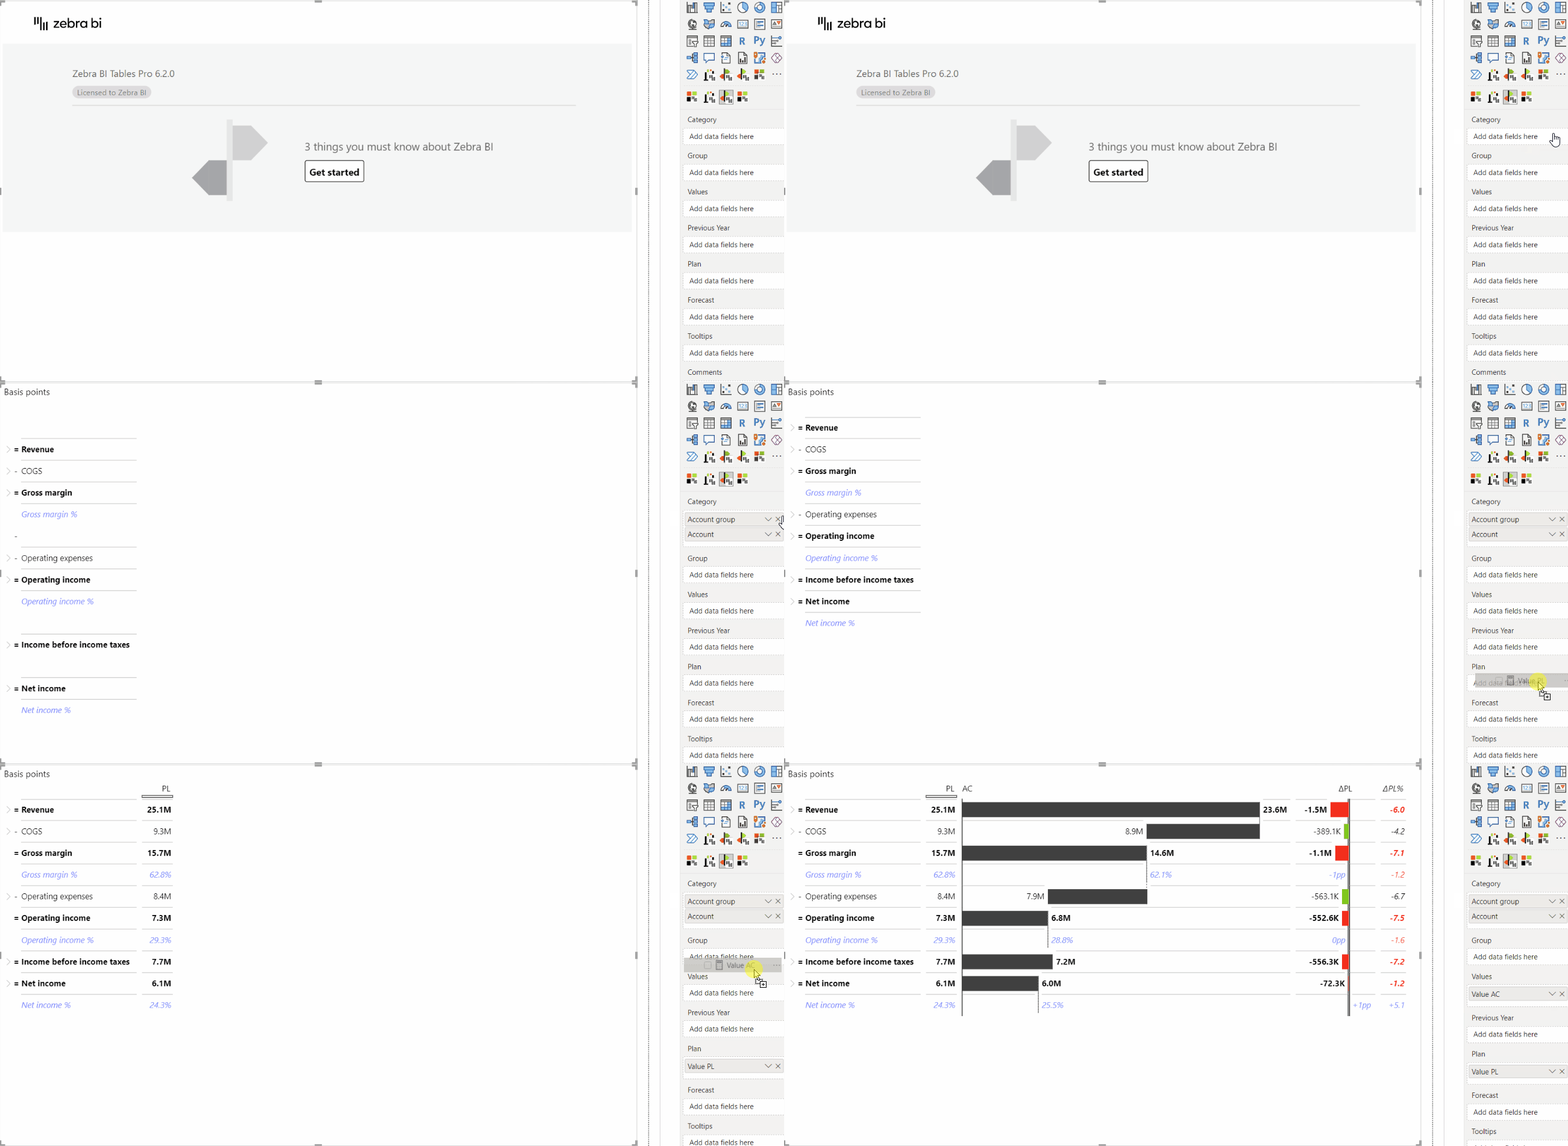
First, create a table using Zebra BI Tables visual by adding the needed data into the right placeholder.
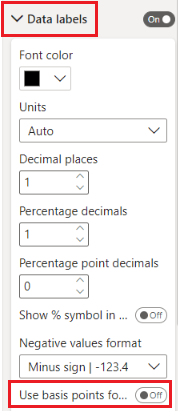
Now let’s go under Data labels in the formatting pane and search for the ‘Use basis points format‘ setting.
Turn this setting on and you can immediately observe the changes on the visual.
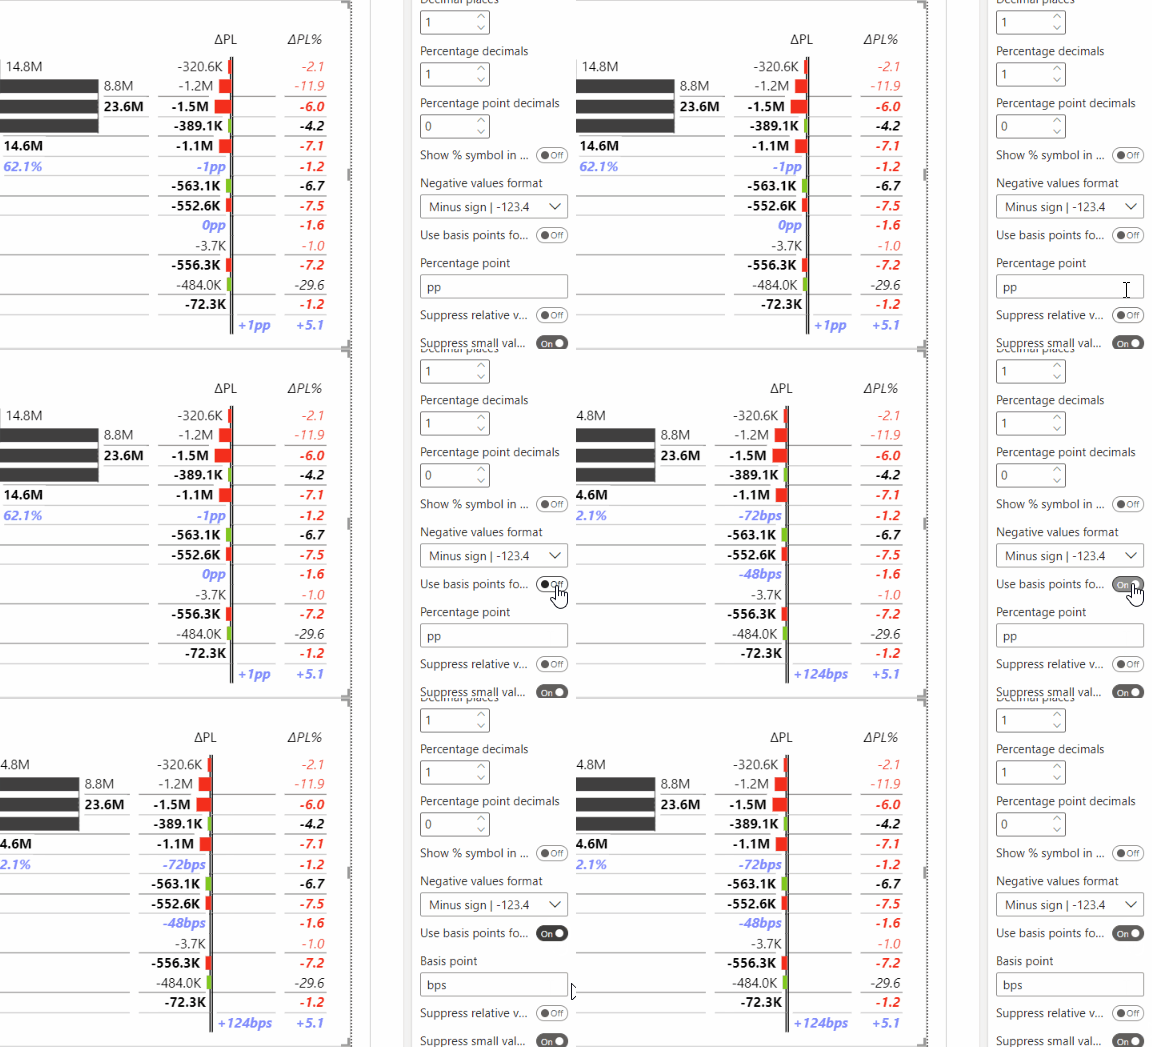
Additionally, you can also apply a few other settings to make a report with basis points even more detailed.
First, you can rename the default value ‘bp’ by simply entering a new word under ‘Basis point’.
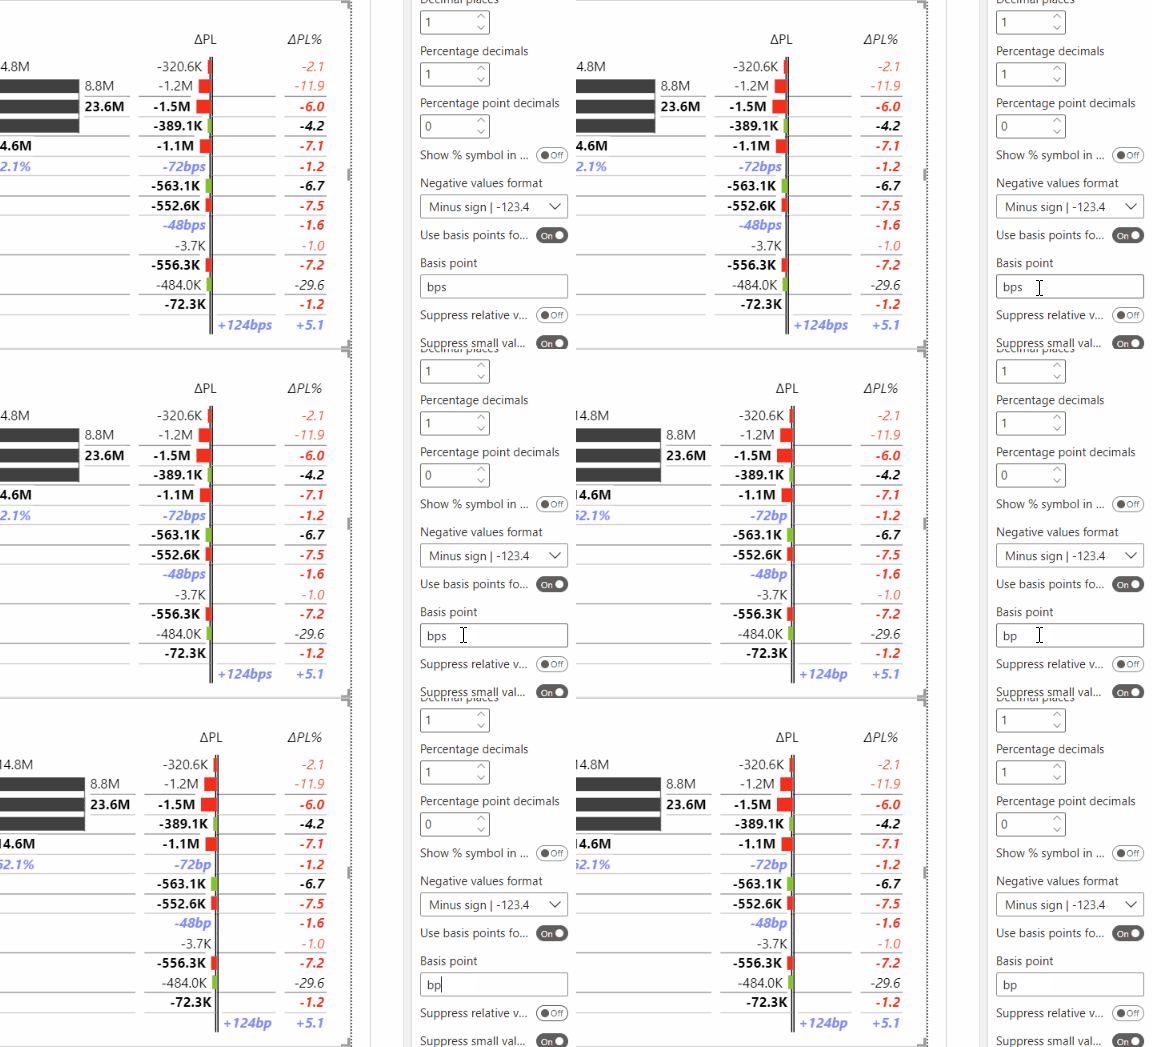
Next, you can suppress the relative variances to remove the clutter from the fields containing basis points. Simply toggle on the setting next to ‘Suppress relative variances.’

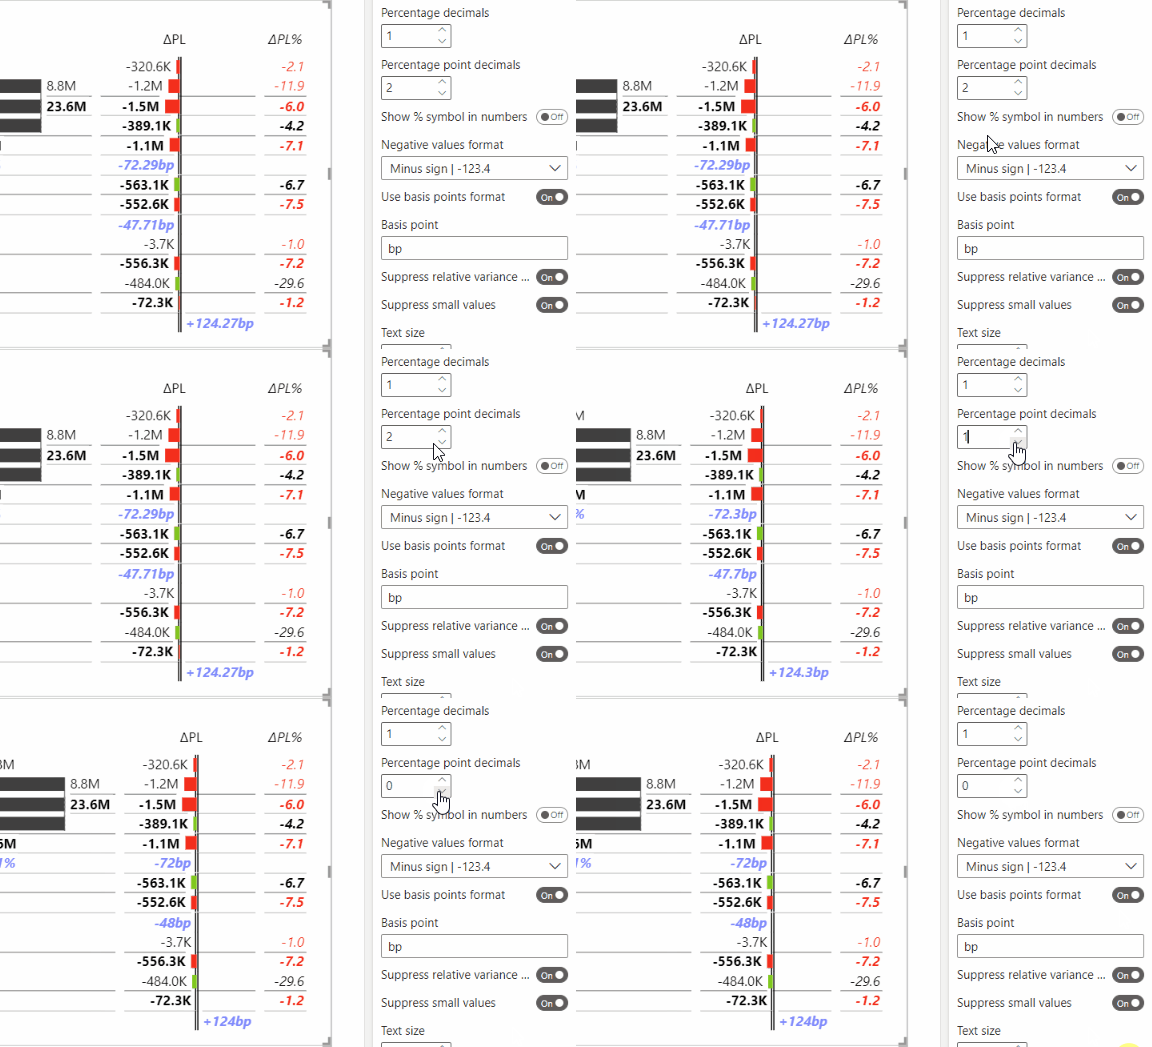
Lastly, you can adjust the number of percentage point decimals or remove them completely by changing the number under this setting.
If you want to switch back to percentage point view, simply toggle off the feature ‘Use basis points’.