Zebra BI Tables and Zebra BI Charts are now richer for one more improvement. We have enabled the feature to interpret data label formats directly configured within the data model. With this capability, Zebra BI Tables and Charts can now accurately interpret formatting applied directly to measures, offering full support for formats specified in Dynamic format strings and Calculation groups.
By default Zebra BI recognizes the significance of data labels, using algorithms to ensure they are automatically presented most optimally.
How to access the “Format from model” option
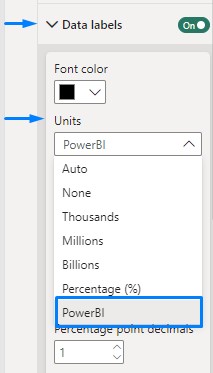
To access the setting enabling the visual to adopt the format from the model, navigate to Settings -> Data labels -> Units and select Power BI
Simple example with Dynamic format strings
Let’s delve into a straightforward illustration to understand this process better.
Suppose we want to include currency symbols alongside our numbers in a visual. Initially, we need to ensure that the appropriate formatting is applied to the measure. In our scenario, this formatting was achieved through the utilization of a Dynamic formatting option directly on the measure.
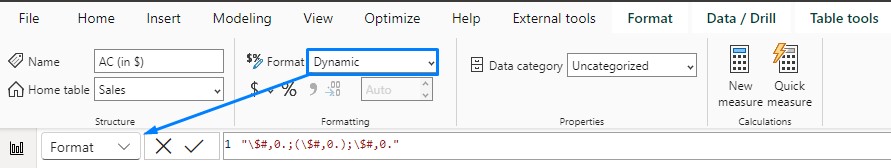
Changing the format from any static option to the Dynamic option will automatically prepopulate in the DAX formula bar when the Format list box left of it is selected.
"\$#,0.;(\$#,0.);\$#,0."
The newly set format is reflected in the visual when we change the setting mentioned above.
Example with formats set in the Calculation group
In general, the Calculation groups feature was presented to enhance the capabilities of modeling and analysis in Power BI. They allow users to define reusable sets of calculations which can be applied across multiple measures. Calculation groups help in simplifying and standardizing calculations across measures, promoting consistency and maintainability in Power BI models.
We would like to focus on the main KPIs in our Sales data. Since KPIs are often presented in different units, sums, ratios, etc., we need to make sure they reflect these units by default. Using a Calculation group feature for this particular situation is a great option since the same formatting logic can be applied across all measures in a data model.
First, let’s go to the Model view and select the Model tab in the Data pane. Create a new Calculation group from the button shown in the Properties pane or by right-clicking on the Calculation group in the Semantic model.
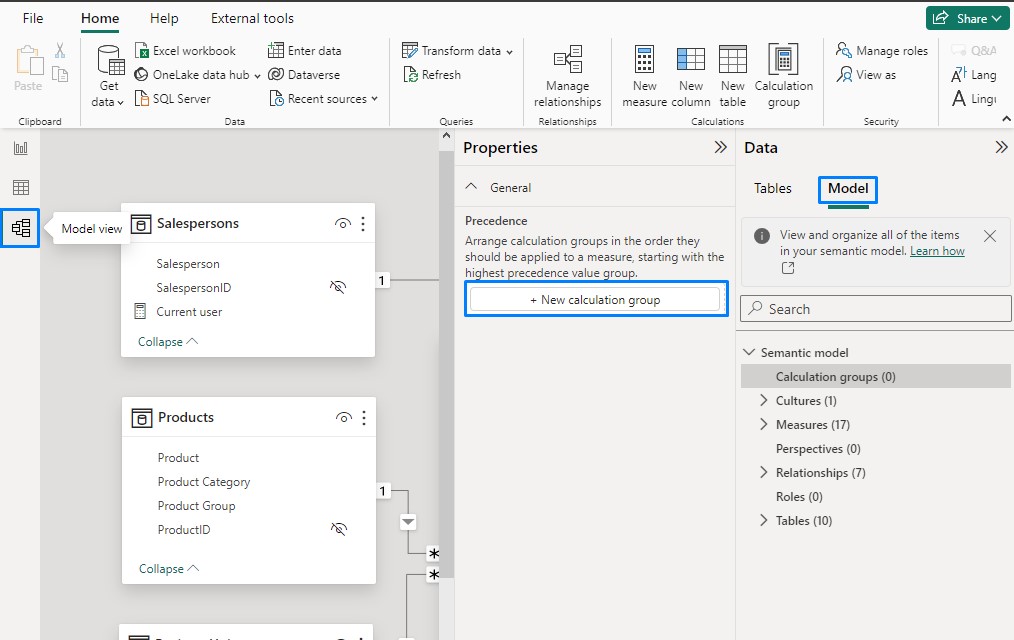
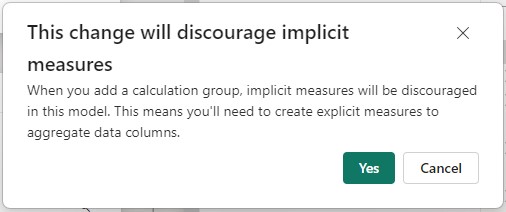
When doing so you will immediately be informed that this action will discourage implicit measures. Why does this happen? Implicit measures refer to measures that Power BI automatically generates based on the fields utilized in a visualization. However, when a Calculation Group is established, Power BI implements certain alterations to the model behind the scenes, effectively disabling implicit measures. Consequently, any aggregations dependent on implicit measures will no longer work.
After confirming the above, a calculation group will be created along with the first calculation item. The automatically created calculation item uses the SELECTEDMEASURE () DAX expression, which means it will apply to the measure in context. We can rename the calculation item in the Properties.
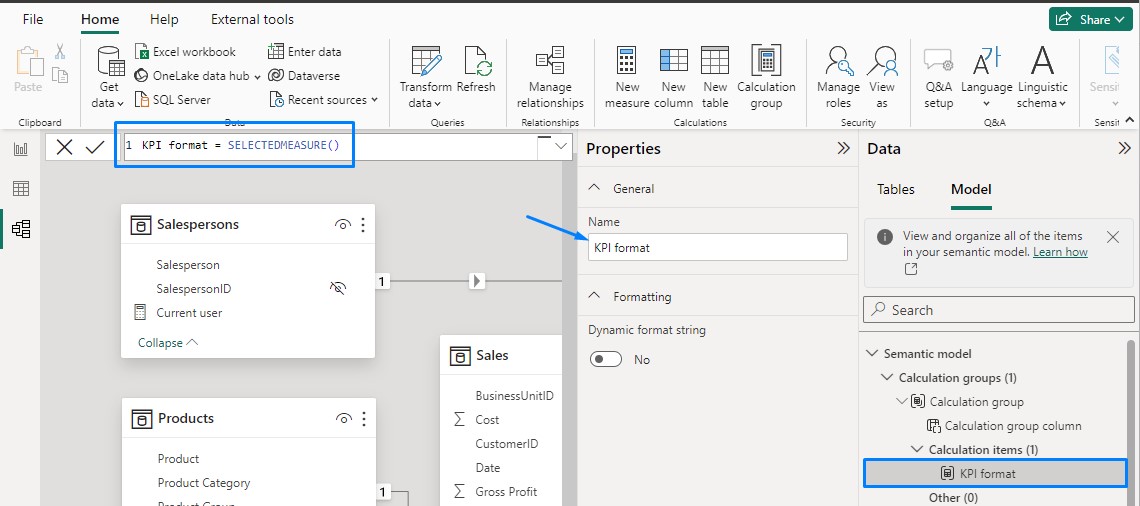
Calculation groups can also use the Dynamic format strings functionality enabling the application of varied formats to different KPIs. This feature can be activated through the Properties.
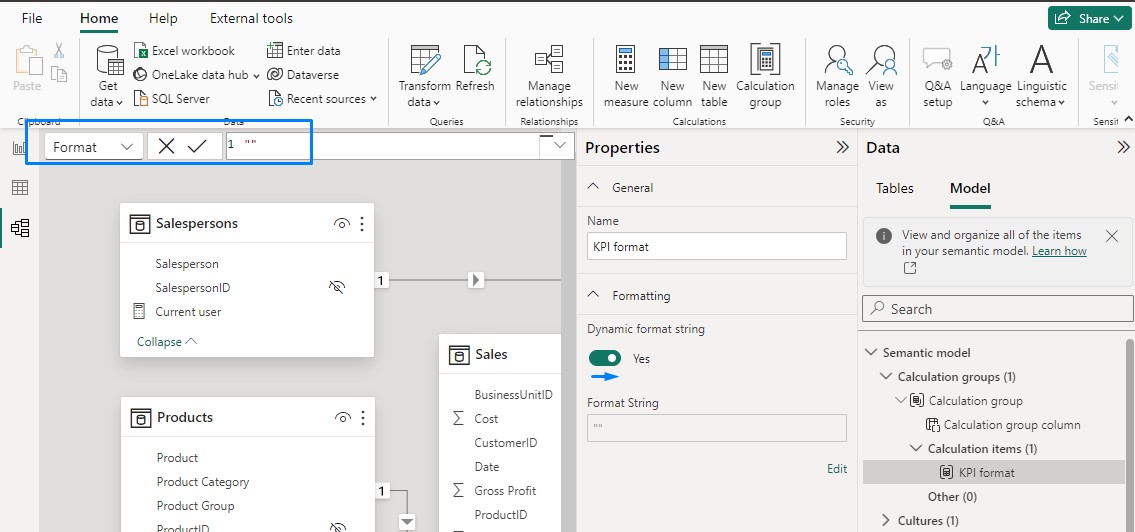
Following activation, a new DAX formula bar will appear where we can now insert the formatting logic for our KPIs. Depending on the number of KPIs you can predefined the formats in a disconnected table and call the formats specified in that table. In our example, we utilize four KPIs, with only one requiring distinct units. The corresponding formula is as follows:
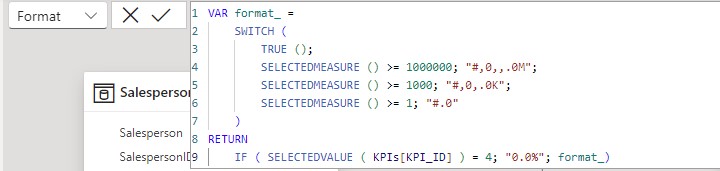
Below is the DAX you can directly copy and paste into your Power BI.
VAR format_ =
SWITCH (
TRUE (),
SELECTEDMEASURE () >= 1000000, "#,0,,.0M",
SELECTEDMEASURE () >= 1000, "#,0,.0K",
SELECTEDMEASURE () >= 1, "#.0"
)
RETURN
IF ( SELECTEDVALUE ( KPIs[KPI_ID] ) = 4, "0.0%", format_)
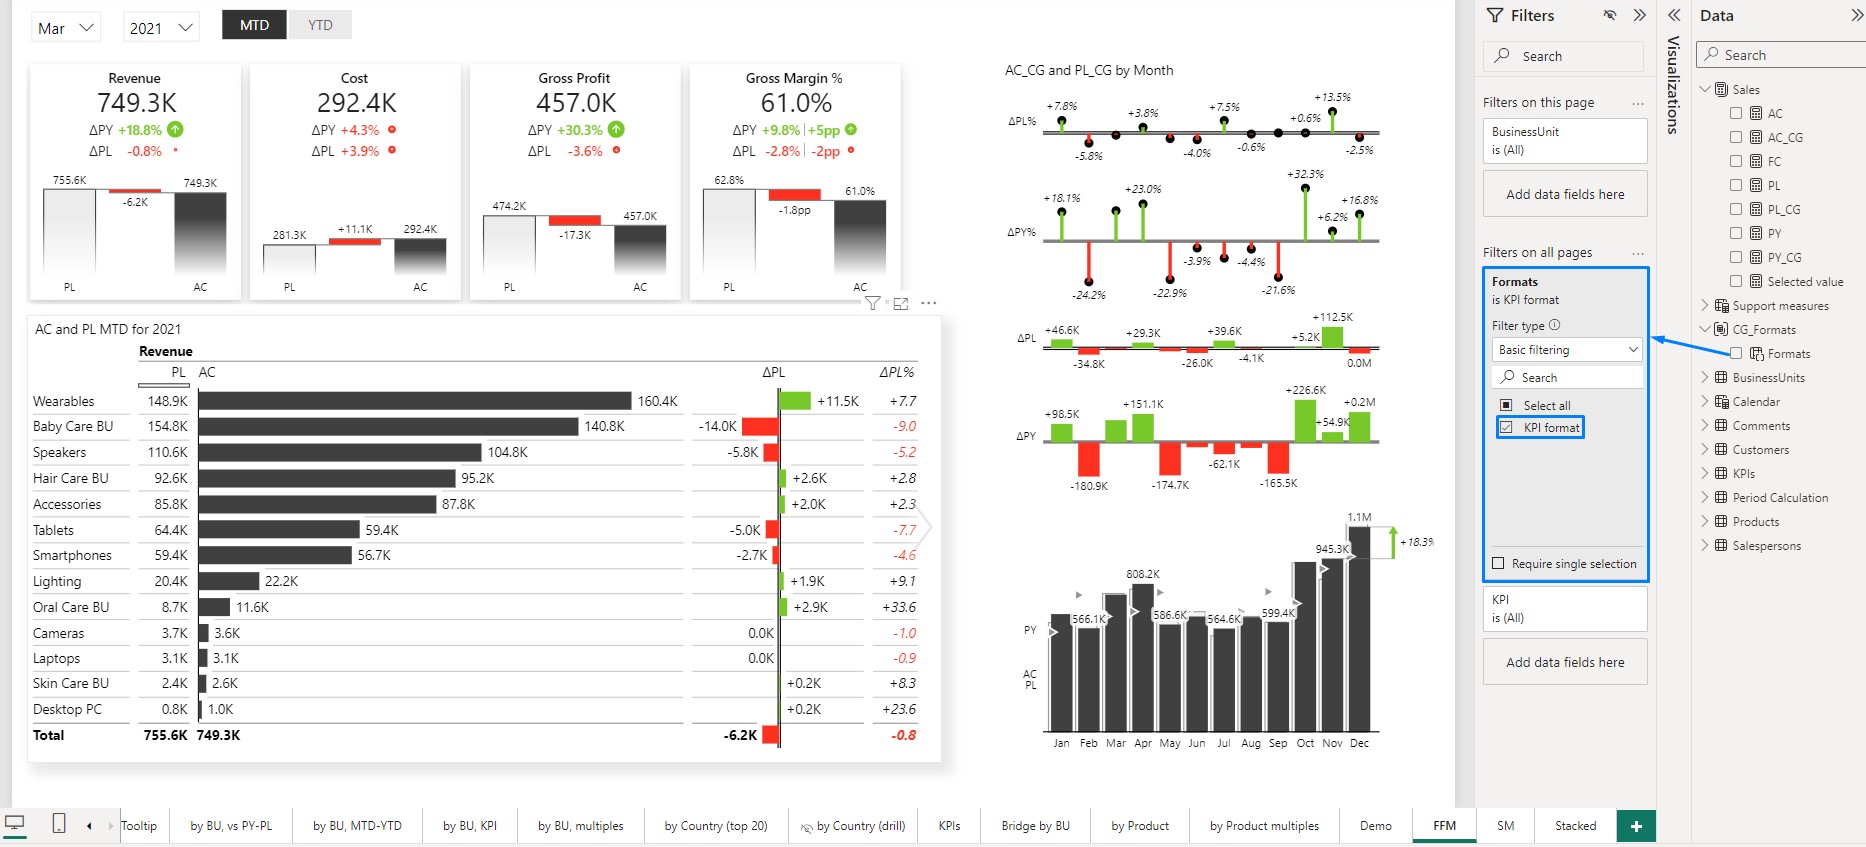
In the provided DAX formula, we aim to assign specific units based on their respective values. If a KPI represents a ratio, it should be presented in percentage format. Moving forward, let’s examine the following example. We will integrate the previously created calculation group for formatting into the Filters on all pages and select the KPI format to apply the logic universally across all measures within this report.
An advantage of using a calculation group compared to the dynamic format directly on the measure is you only need to do this once and it is uniformly applied to all measures.