In Power BI you can save specific views in bookmarks, link the bookmarks to buttons, and let the user activate the predefined views with the click of a button. There is a huge variety of use cases for bookmarks but they are mainly used to make navigation easier for the end-user.
Let’s get straight to it. To be able to properly work with bookmarks, we need to activate 2 additional views in Power BI Desktop. To do this, select View from the menu and then activate Bookmarks and Selection. This will add these 2 panes next to the Visualizations on the right-hand side of the screen.
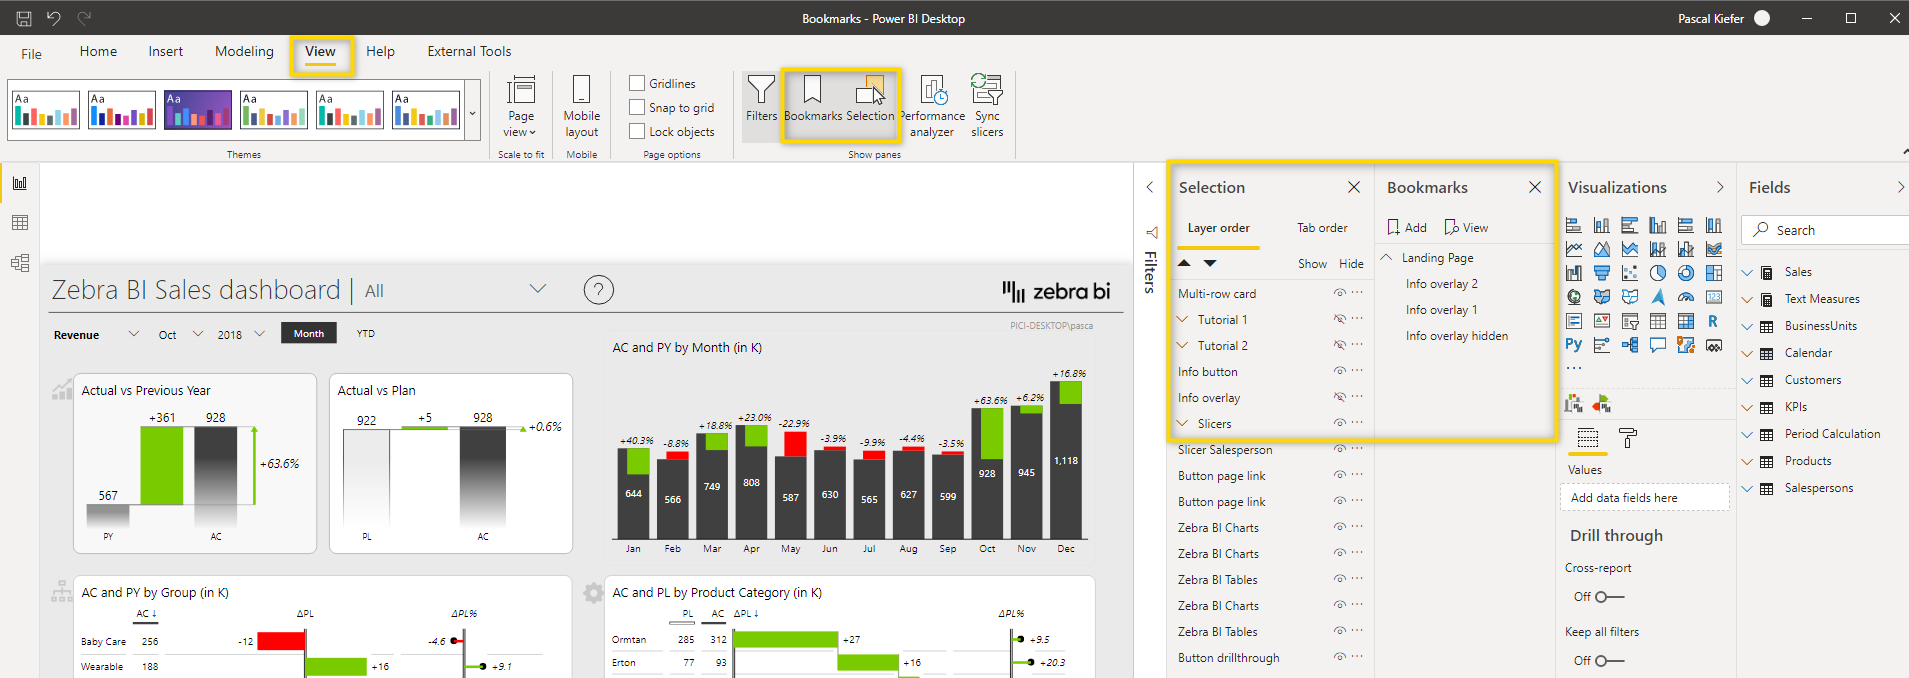
Selection Pane
The Selection pane shows a list of all elements which are included on the selected page. Below are some useful things to know about the selection pane:
- You can select an item from the list and it will be highlighted in the report.
- To keep the Selection pane tidy, you can group elements that belong together into a group. To do this, press Ctrl on your keyboard and then select the elements you’d like to group with your mouse. Then you just right-click and select Group. You can then rename the new group and also add additional elements to the group using drag and drop.
- The order of the elements is actually how they are layered in the report view. So if you have two or more elements that overlap each other in the report, you can decide which elements are on top or behind the other one by changing their order in the selection pane. You can use drag and drop to do this or the arrow buttons on top of the selection pane.
- Elements or groups of elements can be shown or hidden. A click on the eye icon on the right of every element changes the show/hide setting.
- In the Tap order view, you can define the order of the elements that are selected when the user presses the Tab key. To see this work, go to the Tab order on top of the selection pane, select any elements on the report, and press the Tab key on your keyboard. You will see that one element after the other is selected. The order in which this happens is defined in the Tab order. Simply rearrange the order with drag and drop or with the arrow buttons on top. You can also exclude elements from the tab order by selecting the number of the element on the left
It’s best if you try out all these options in the attached sample report or in any of your reports, in order to familiarize yourself with them.
Bookmark Pane
The Bookmarks pane shows all bookmarks which exist in the entire report. This is what you need to know about the Bookmark pane:
- The Add button on the top adds a new bookmark with the currently selected view.
- The View button on the top is used for presentations, sort of when you want to have a slide show of all your bookmarks. When you select the view mode, you will notice that navigation buttons appear below the report so you can easily move between bookmarks.
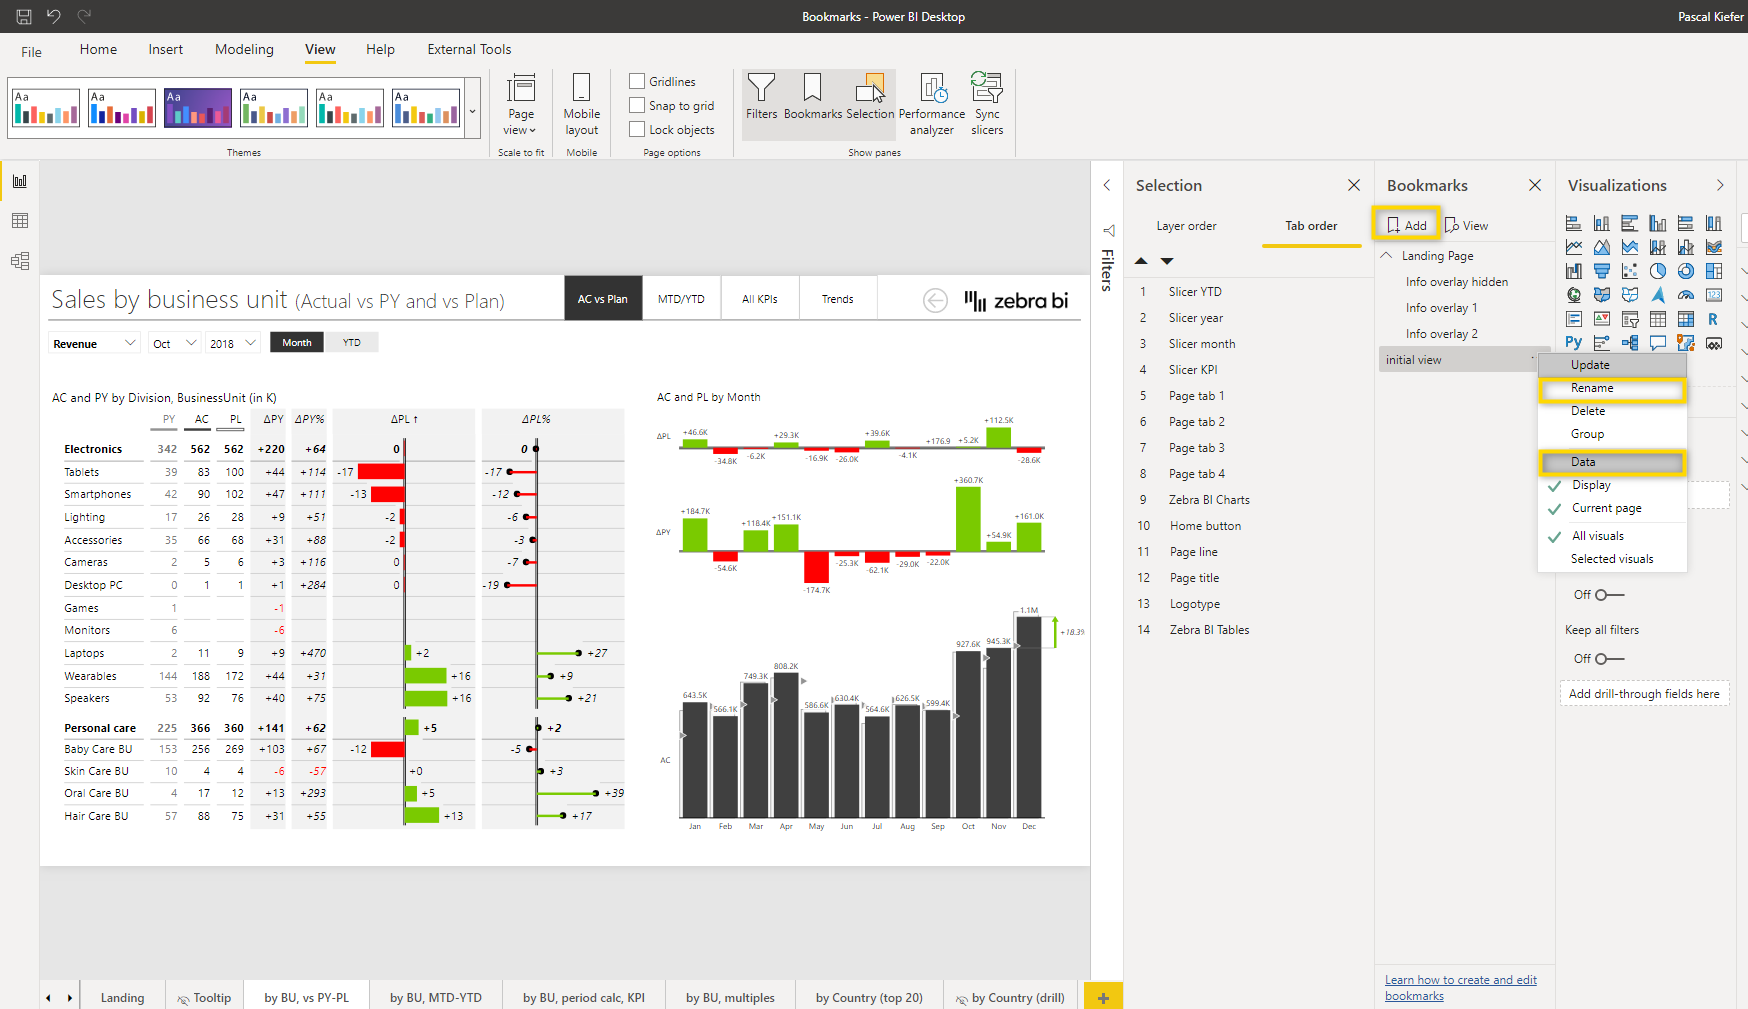
- When you select the ellipse on the right-hand side of a bookmark, you can see and change the setting of the specific bookmark. Let’s look at this menu in more detail:
- Update: Update an existing bookmark with the current view.
- Rename: Renames a bookmark.
- Delete: Delete a bookmark.
- Ungroup: Remove the bookmark from the group it’s currently in.
- Data: Make the bookmark remember what data you have currently selected and show this selection again when activating the bookmark later on. One possible scenario is that you have a slicer on the page in which a specific year is selected. If Data is activated in the bookmark, this selection is saved and whenever a user selects the bookmark, the same year will be selected again.
- Display: Make the bookmark remember which elements are displayed in the report. This is used when you want to dynamically hide or show specific elements.
- Current page: When activated, the user automatically jumps to the specific page when the bookmark is selected. When this is not activated and the bookmark is executed while the user is on a different page, the bookmark still works but the user doesn’t navigate to the relevant page.
- All visuals: All visuals on the page are affected by the bookmark.
- Selected visuals: Only the selected visuals are affected by the bookmark. Once a bookmark has been created, there’s no option to see which elements/visuals are affected by the bookmark, and in order to change which elements are affected, you need to select the relevant objects and update the bookmark.
As you can see, there are a lot of different things you can do with bookmarks and this can be a bit overwhelming but once you get the hang of it, you will see that there is amazing stuff that can be achieved with bookmarks.
Practical Examples
Let’s see some of these options in action
As an example, we will create a help screen for an end-user. What does this entail? The user clicks on a button showing a question mark, a yellow box with an animated GIF is shown, the report in the back becomes slightly greyed out and there’s a button to navigate between different tips. Setting up this exact scenario takes a couple of steps and we won’t cover everything in detail in this article but once you have read to the end and have downloaded the sample PBIX file, you should be able to reproduce how it was set up.
Because the bookmarks on the Landing page of the sample report already work properly, we’ll create some end-user help on the page
by BU, vs PY-PL.
First, let’s create a bookmark for the view which doesn’t show any end-user help. This is the initial view of the page so the only thing that needs to be done is create a bookmark. In the Bookmarks pane, select Add, then rename the bookmark so it’s easy to identify and then, turn off data. Data is turned off because the selection of the slicers should not be saved in the bookmark. It is only used to change the view.
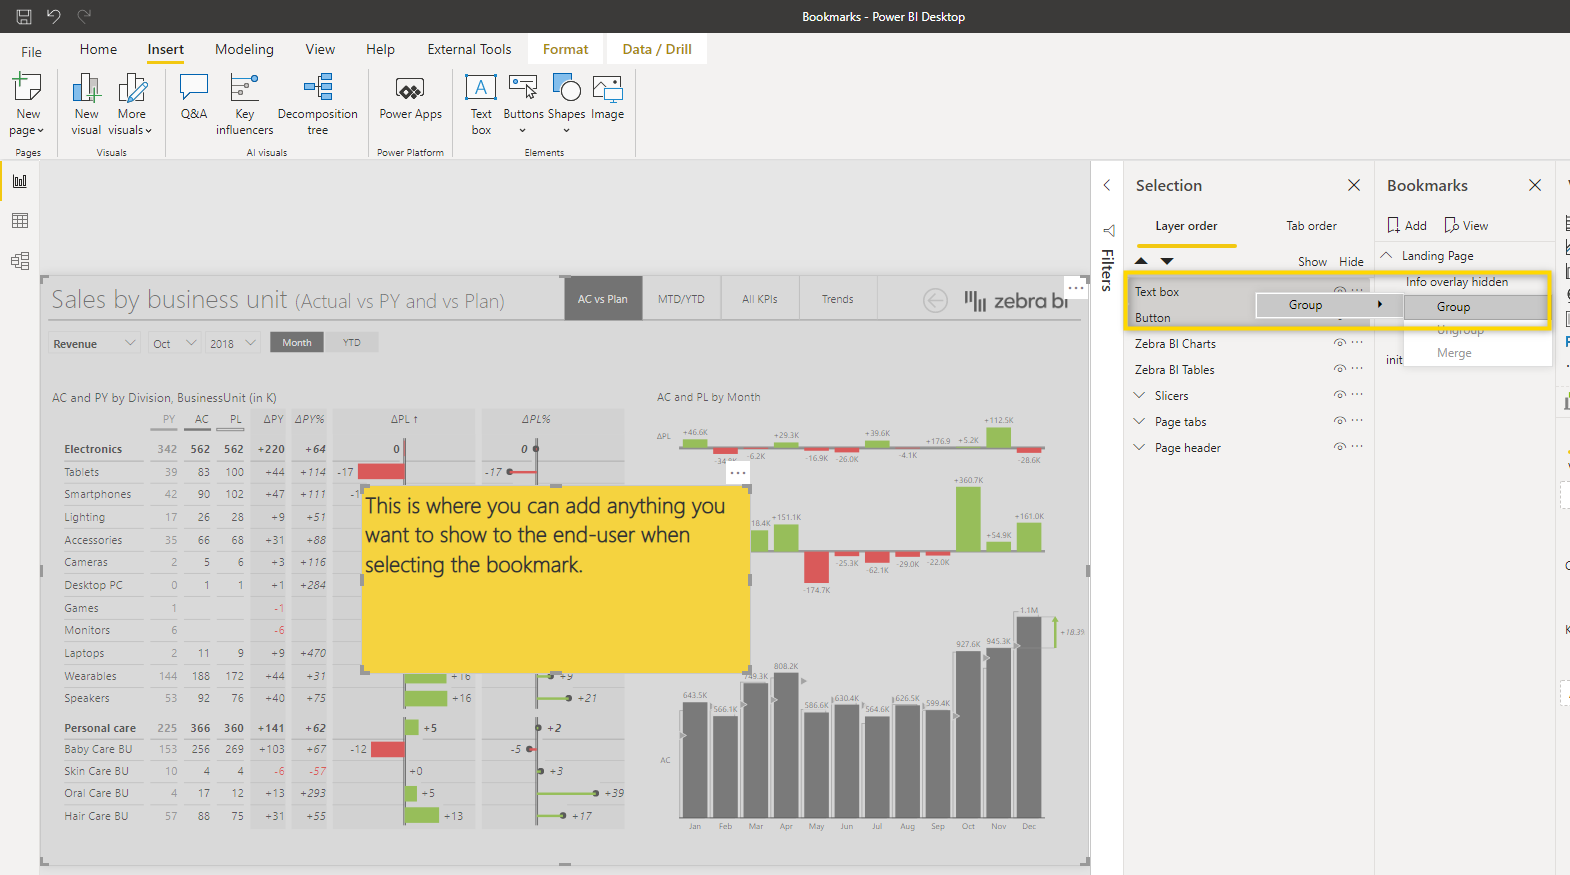
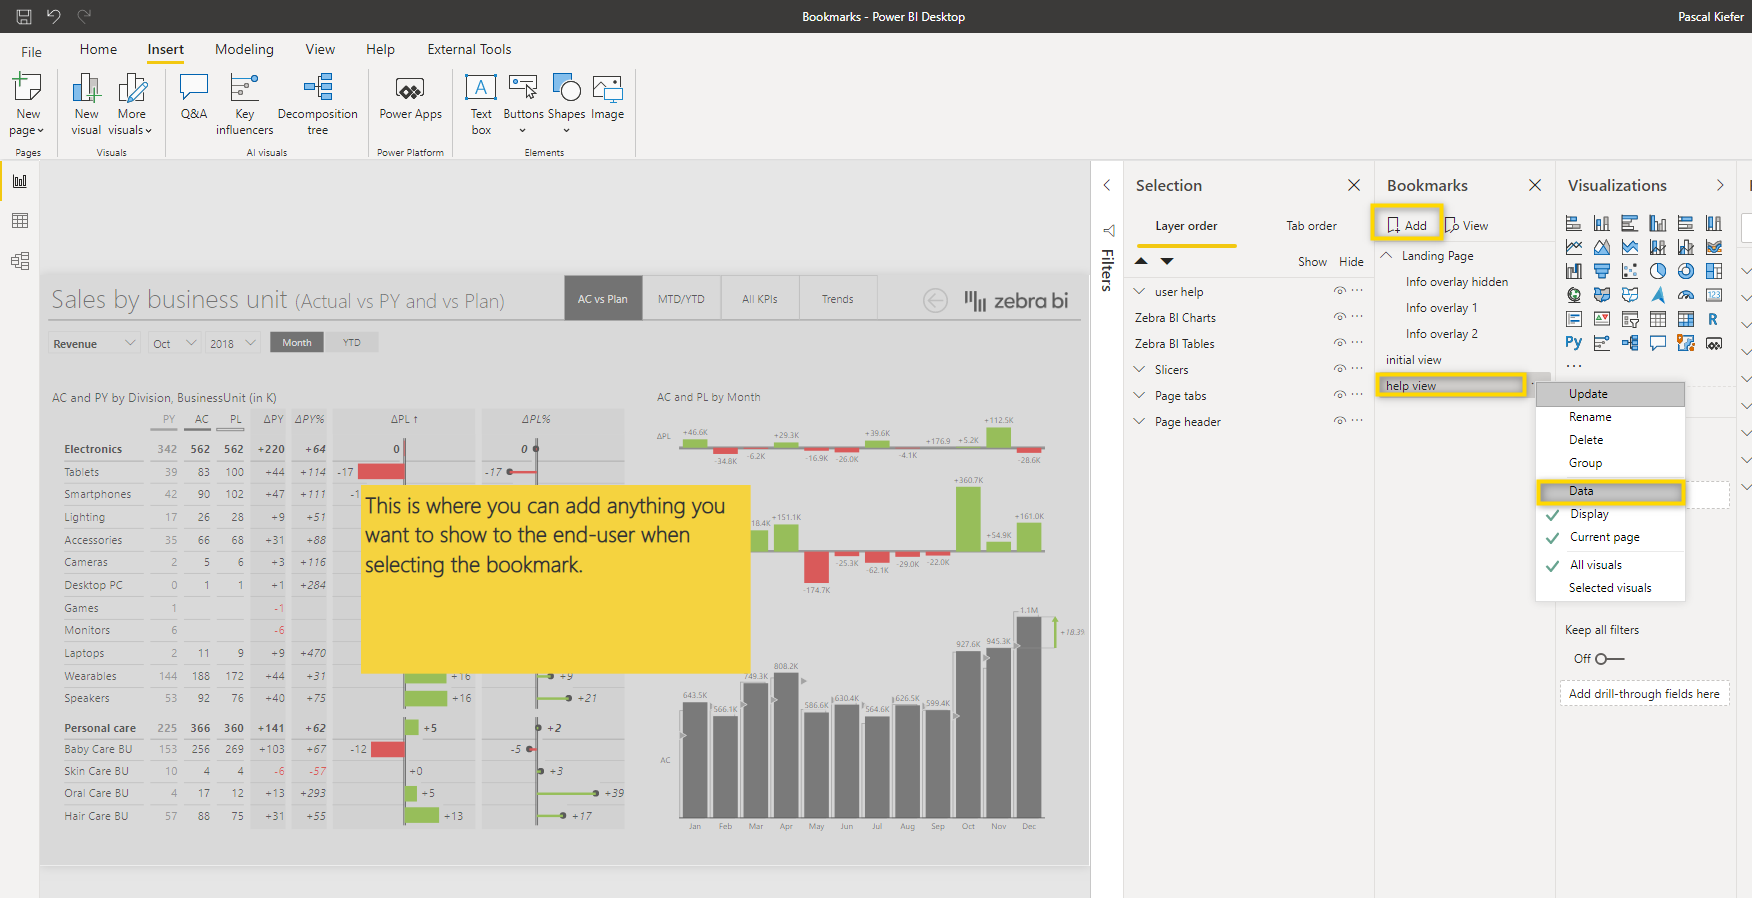
Now we can create the second view, which is the one that includes the end-user help or whatever else we want to show. For illustration purposes, we’ve just added two new elements to the report. We first added a button that covers the entire space of the report and has a semi-transparent background and we also added a textbox that includes the message to the user. Also, note that all the elements which are part of a specific view can be grouped in the Selection pane. This will make it easier to keep the overview and to set up the bookmarks correctly. We grouped the 2 elements into a group called “user help”.
The current view is the one that should be shown when the user selects to see end-user help, so let’s save this bookmark by clicking the Add button in the bookmarks pane. Then we’ll also rename the bookmark and deactivate the data option.
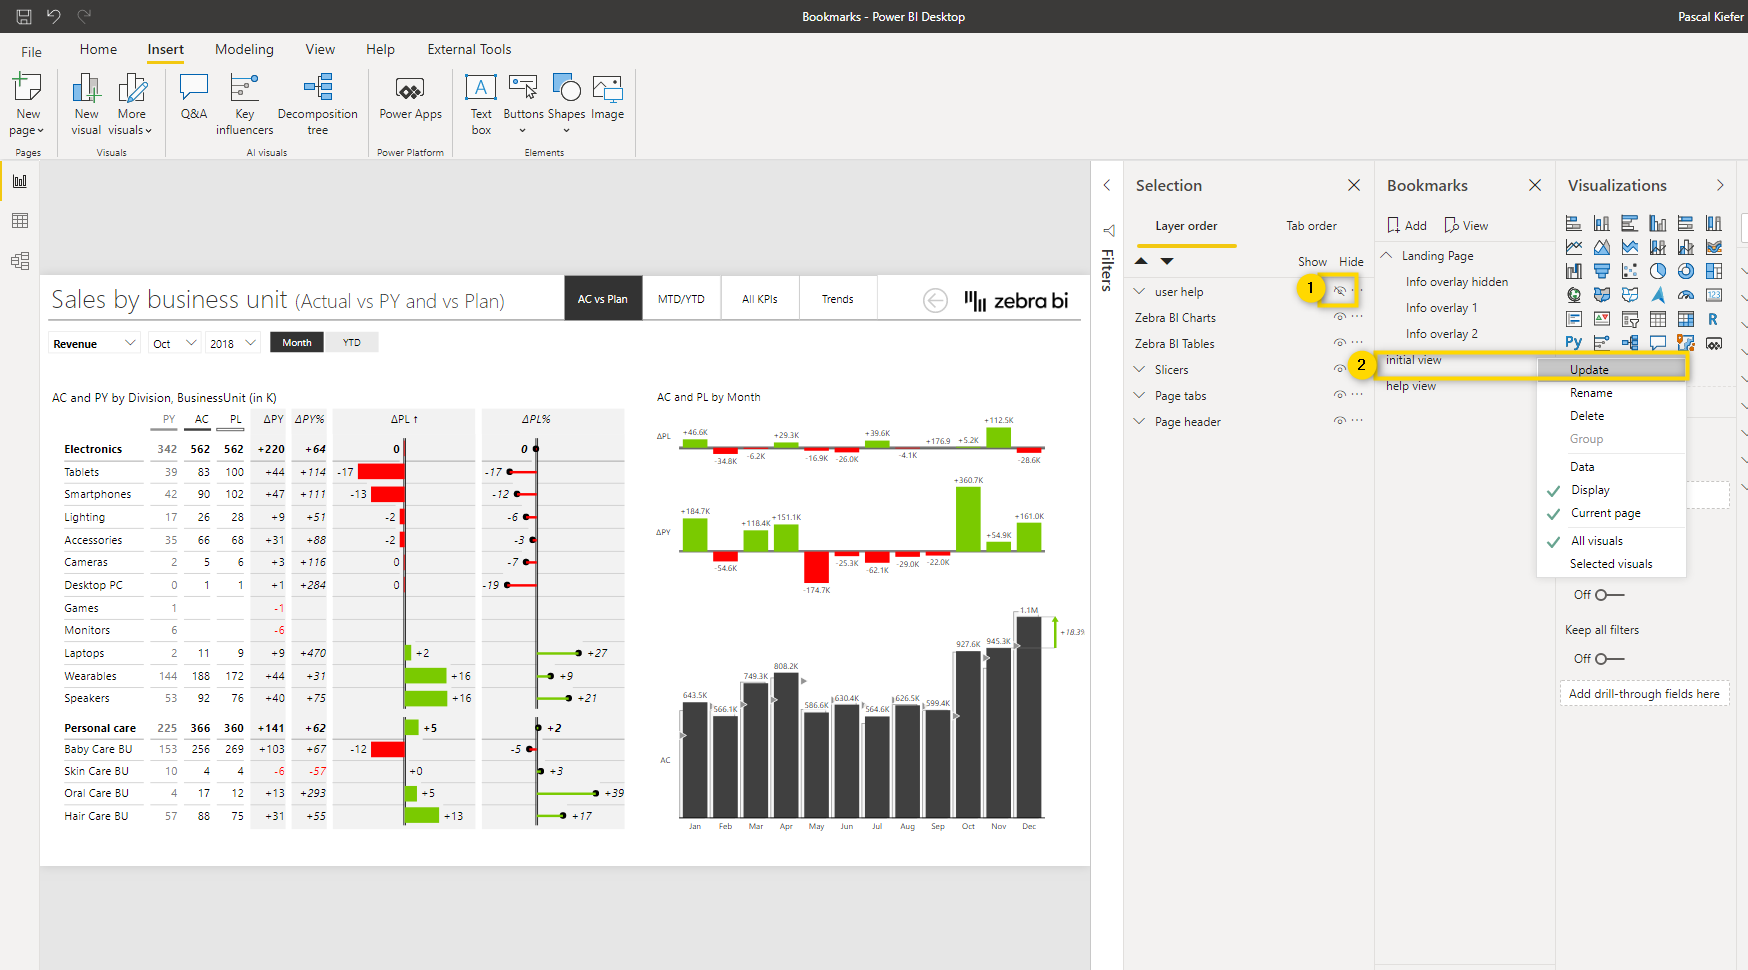
When you now select the bookmark initial view, the user help elements should be hidden but are currently still shown. So the already created bookmark needs to be updated. This should illustrate that the creation of bookmarks is quite important but you can always update a bookmark when new elements are added to the page, that need to be added to a bookmark. Let’s create the view which should be shown when the user selects the initial view bookmark. To do this, hide the user help elements from the selection pane by clicking on the eye symbol next to it and then update the initial view bookmark.
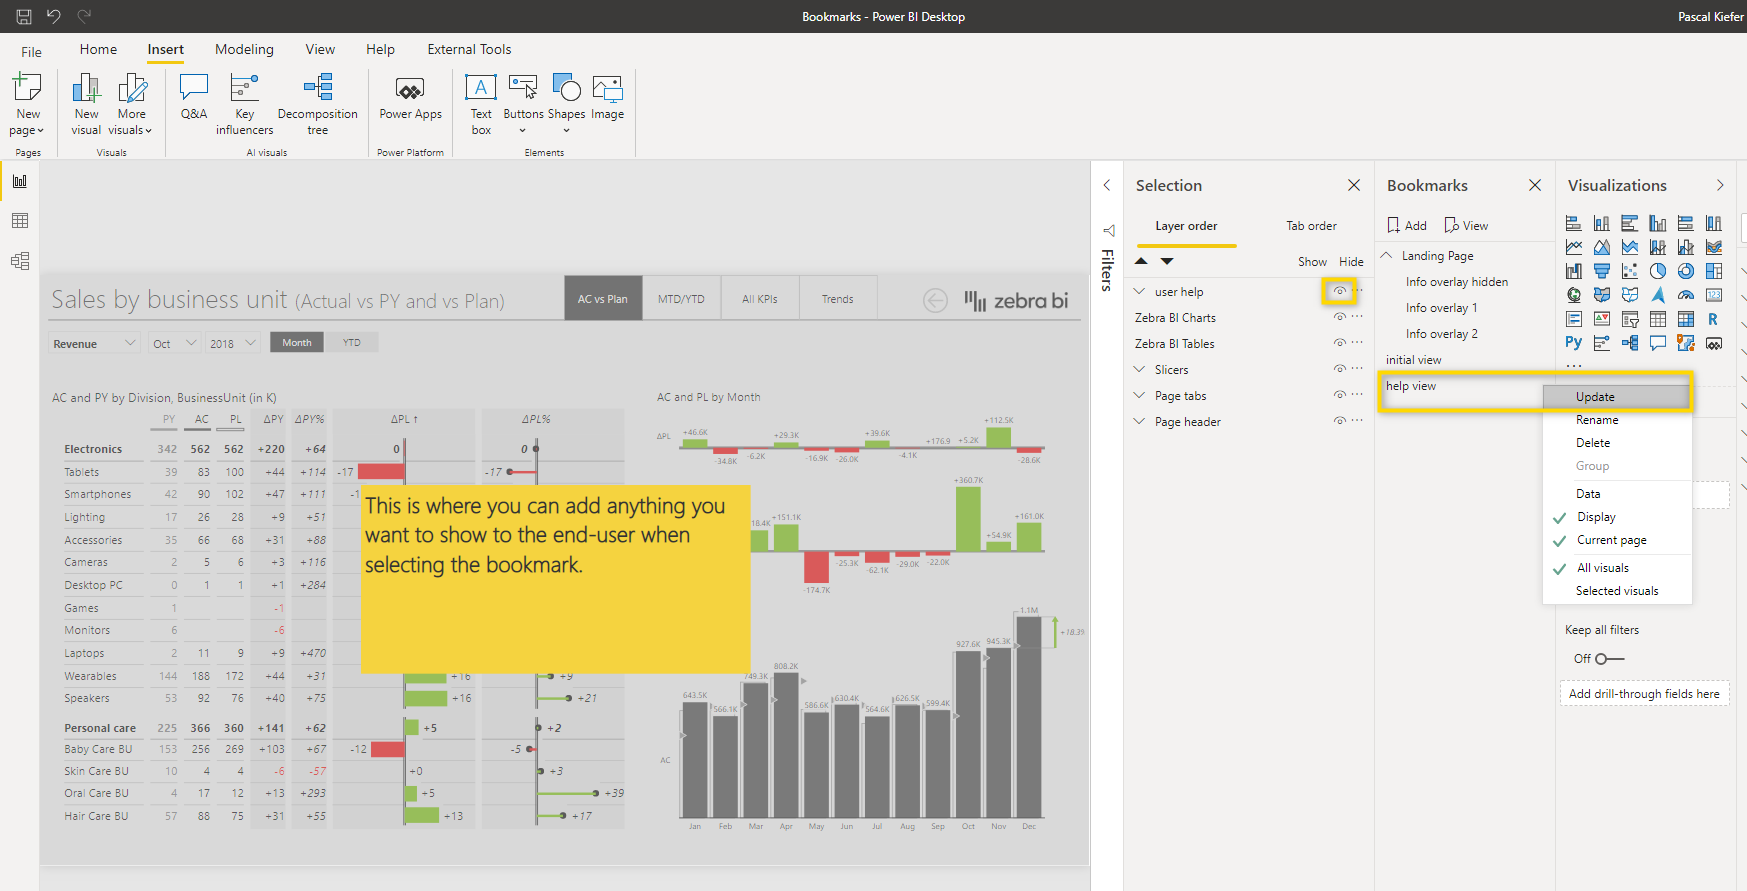
Now you can select the two newly created bookmarks in the Bookmarks pane and should see the two different views. In case the correct elements are not shown, just update the desired view and update the bookmark. If the user help is not shown in the help view bookmark, just unhide the elements and then update the bookmark.
Once again, you can test the bookmarks by selecting them in the Bookmarks pane.
The bookmarks work properly now, but they still need to be assigned to buttons so the end-user can select them.
So first let’s add a new button to the report. Because we are showing help to the user, we selected the question mark button.
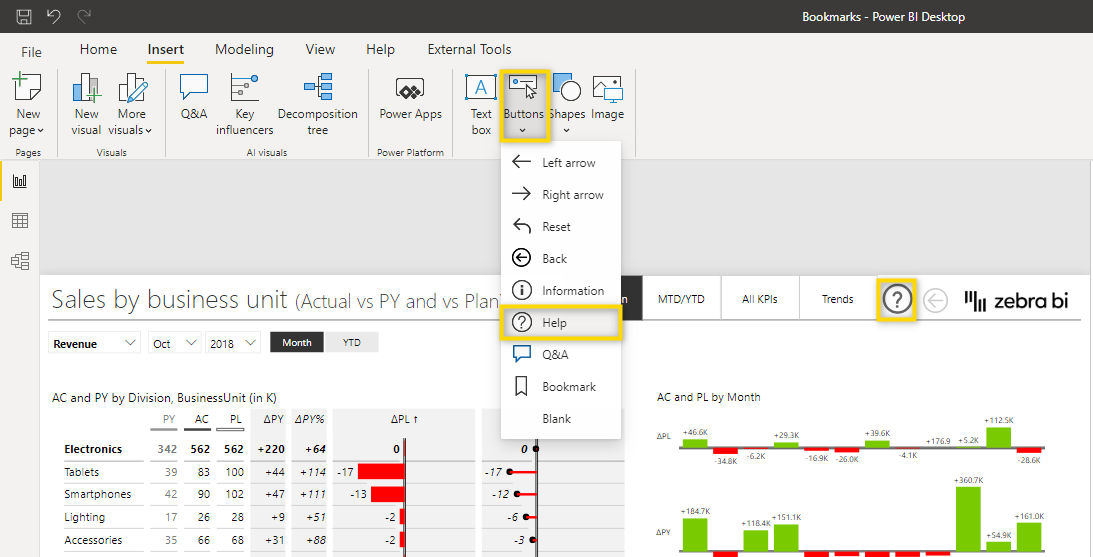
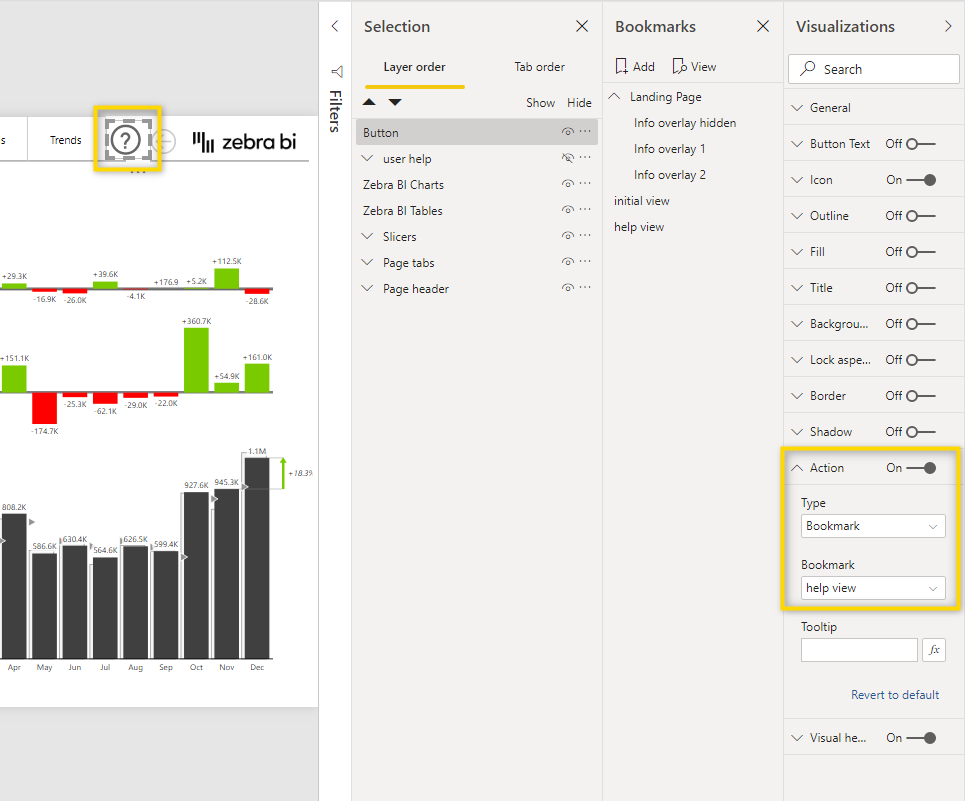
Now we need to assign the bookmark to this button. To do this, select the button and in the formatting section, select Action > Bookmark > help view.
Let’s click the button to see if it works. Remember that in Power BI Desktop, you need to press
Ctrl on your keyboard and then click a button to make it work. In Power BI Service, this is not necessary and a simple click is enough to trigger the action of the button. You can see that the bookmark is activated when the button is clicked but the button is actually on top of the user help because it’s on the first position in the Layer order in the Selection pane.
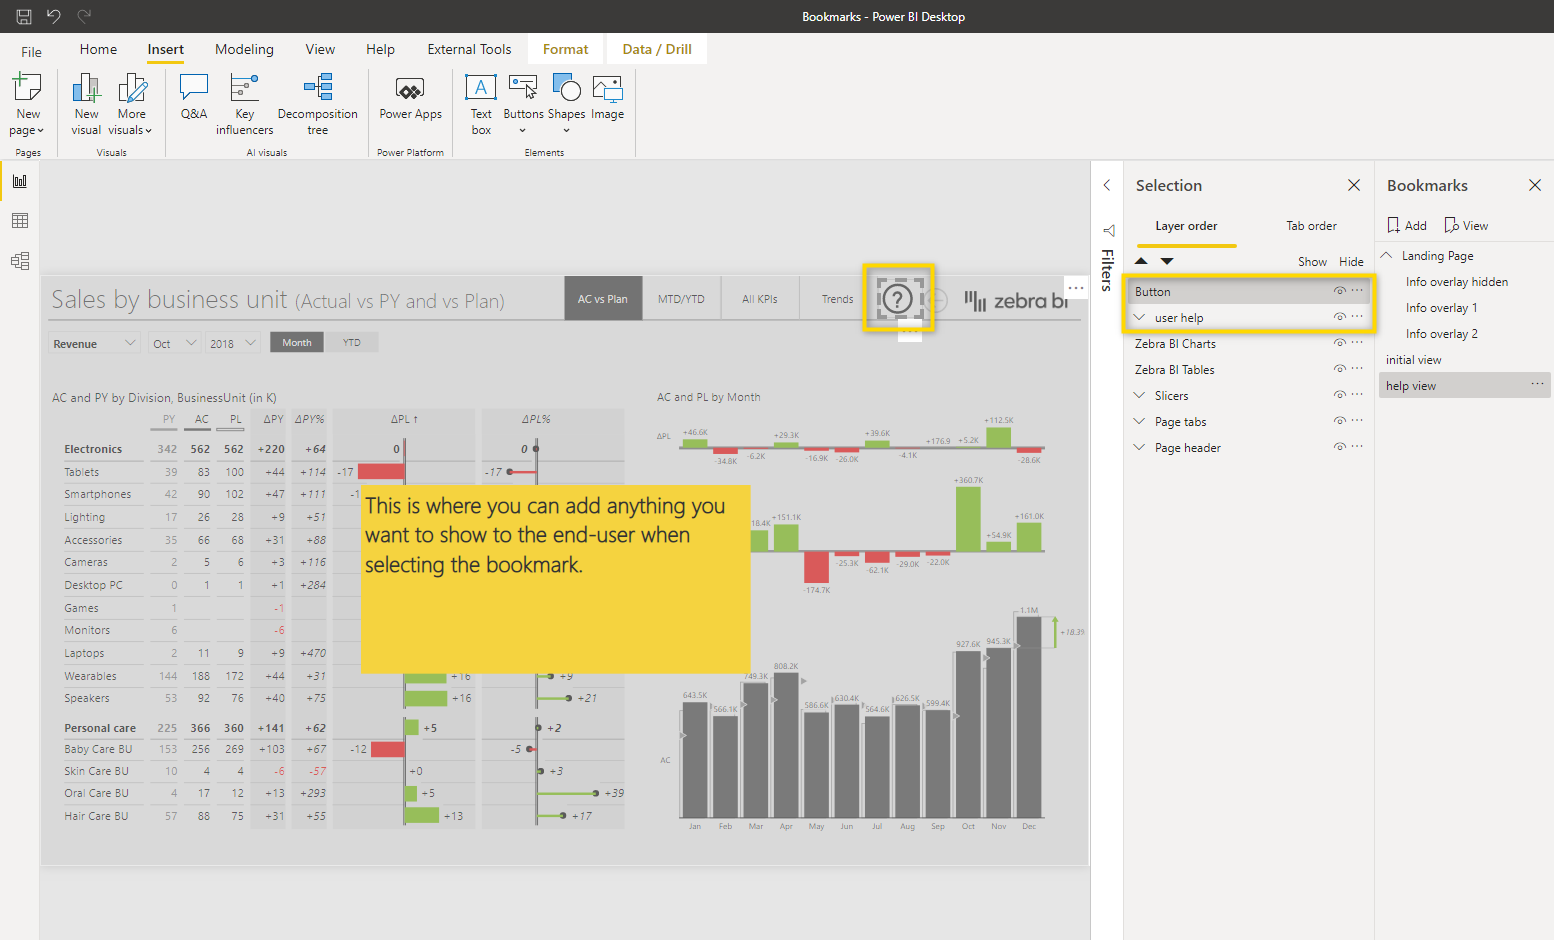
To make the button move behind the user help, we just drag and drop it below the user help in the Layer order view.

Now we also need a button to close the end-user help. We can use the already created big grey button in the back of the end-user help. So let’s select this button and configure the action in the format settings.
You can now use the 2 buttons to switch between the different views.
As you could see in this article, bookmarks are a great way to improve your Power BI report. There are so many effective things that can be done with bookmarks. Everything above is just a sample, use your creativity to increase the user experience of your own end-users. They will appreciate it a lot, as it makes their lives much easier.