To start creating stunning reports with the Zebra BI visuals for Power BI, you just need to import them from the Microsoft AppSource into your Power BI Desktop. To unlock the full (Pro) version, you have to activate your Zebra BI license key as well.
Watch how to easily import Zebra BI visuals into your Power BI.
Import visuals from Microsoft AppSource
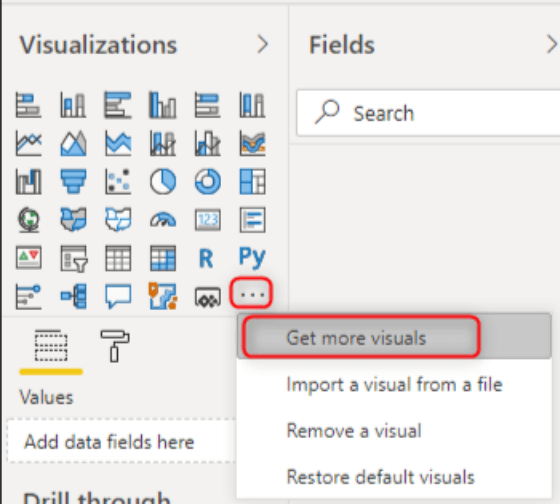
In your Power BI click on the three-dotted icon (…) in the Visualizations pane and select Get more visuals. Search for “Zebra” in the AppSource to find all Zebra BI Tables, Zebra BI Charts, and Zebra BI Cards visual. Add them all to your Power BI Desktop.
After you import visuals, you should receive a notification and see the visuals’ icons in the Visualizations pane.
Add your data to start using visuals
Click on the icon in the Visualization pane to insert the visual into the report page. The visual will display a blank landing page ready for you to insert your data into it.
Select any of your data fields on the right and drag one to a blank Zebra BI visual to create your first table or chart.
The “Info” button (Zebra BI logo) will show up right in the top-right corner.
Unlock Pro version for advanced data visualization features
To unlock all Zebra BI features including advanced charts and tables, income statements (P&L), and complete flexibility in visual styling, you need a Pro license key.
There are two ways of getting the license key: you can either sign up for a free trial or simply purchase your Pro license right away. Our Pro license key is valid for all visuals (Zebra BI Tables, Charts, and Cards).
To insert the license key click on the “Info” button (Zebra BI logo) in the top-right corner.
Copy the license key you received and paste it into the activation window.
After successful activation, you should receive the notification along with the date until when the license is valid.
Even though the license key is valid for all visuals, Zebra BI Tables, Charts, and Cards, they are three separate visuals and you have to insert the license key once for each of them. Power BI Desktop will then remember the license key, so you won’t need to enter it again next time.
To make sure your Zebra BI visuals are easy to access every time you need them (even when you create a completely new Power BI report), pin them to the Visualization pane. To do this, right-click on the visualization icon and then click on the Pin to visualization pane button.
That’s it! You’re ready to start building your reports and dashboards with Zebra BI visuals. Learn more about what type of charts, tables, and cards you can use to create reports that are actionable and understandable.