The Zebra BI Tables visual lets you add subtotals and show totals on both axes of the visual. Both totals and subtotals allow you to round up your high-level data. The space for a perfect Power BI dashboard comes at a premium and that is why it is equally important to give our users the power to exclude the subtotals and totals as they are not always needed.
When creating your first report with Zebra BI Tables visual you will notice the subtotals and totals are missing. Let’s have a look at how to add the grand total for the columns.
Add Grand total to Zebra BI Tables
To add the grand total for columns, click on the visual, then navigate to the visual format section, expand the Chart Settings and turn on the Grand total.
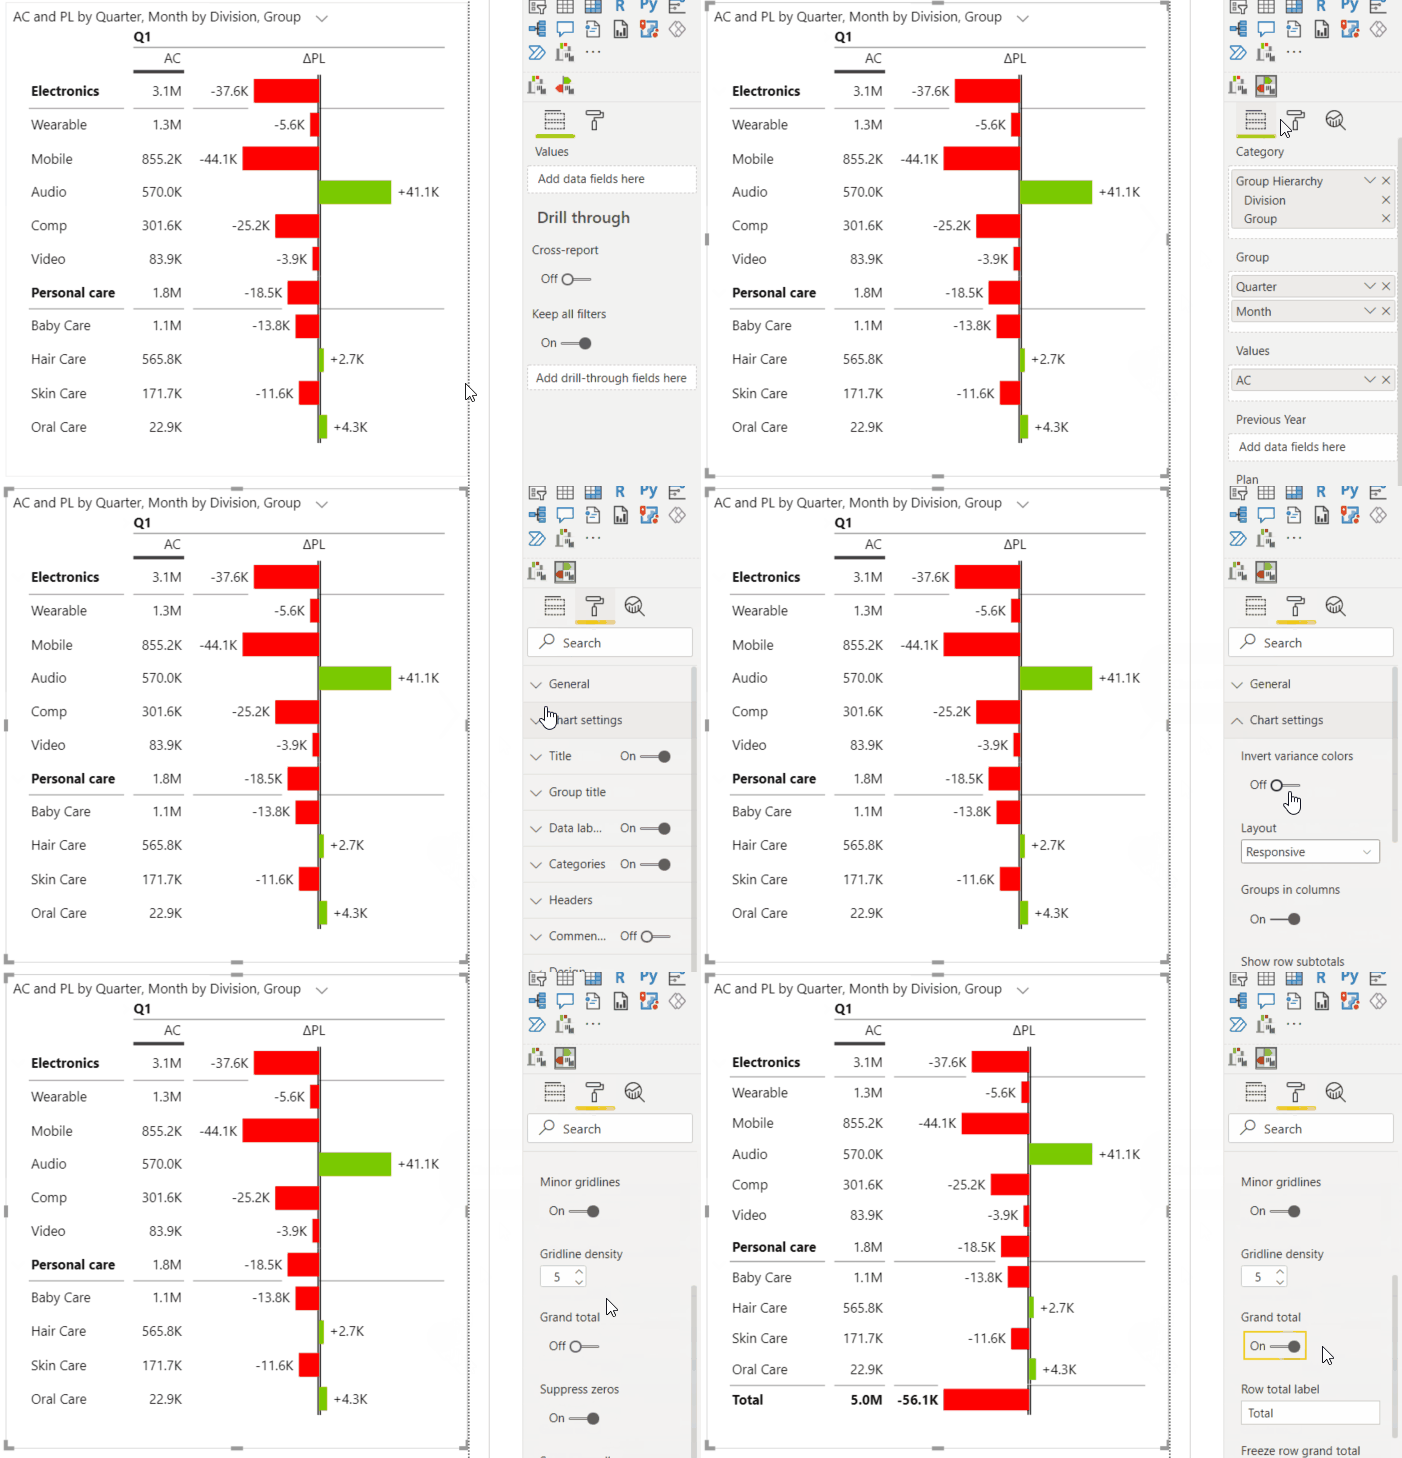
There is an option to rename the Total row label and to freeze to the row, so it will always be visible when scrolling through your table.
To add the grand total for rows, click on the plus (+) symbol, which appears when hovering with your mouse in the top left corner of the visual, and select Show grand total. In our case, we will add the grand total column which will sum up the quarters and will represent the Year column.
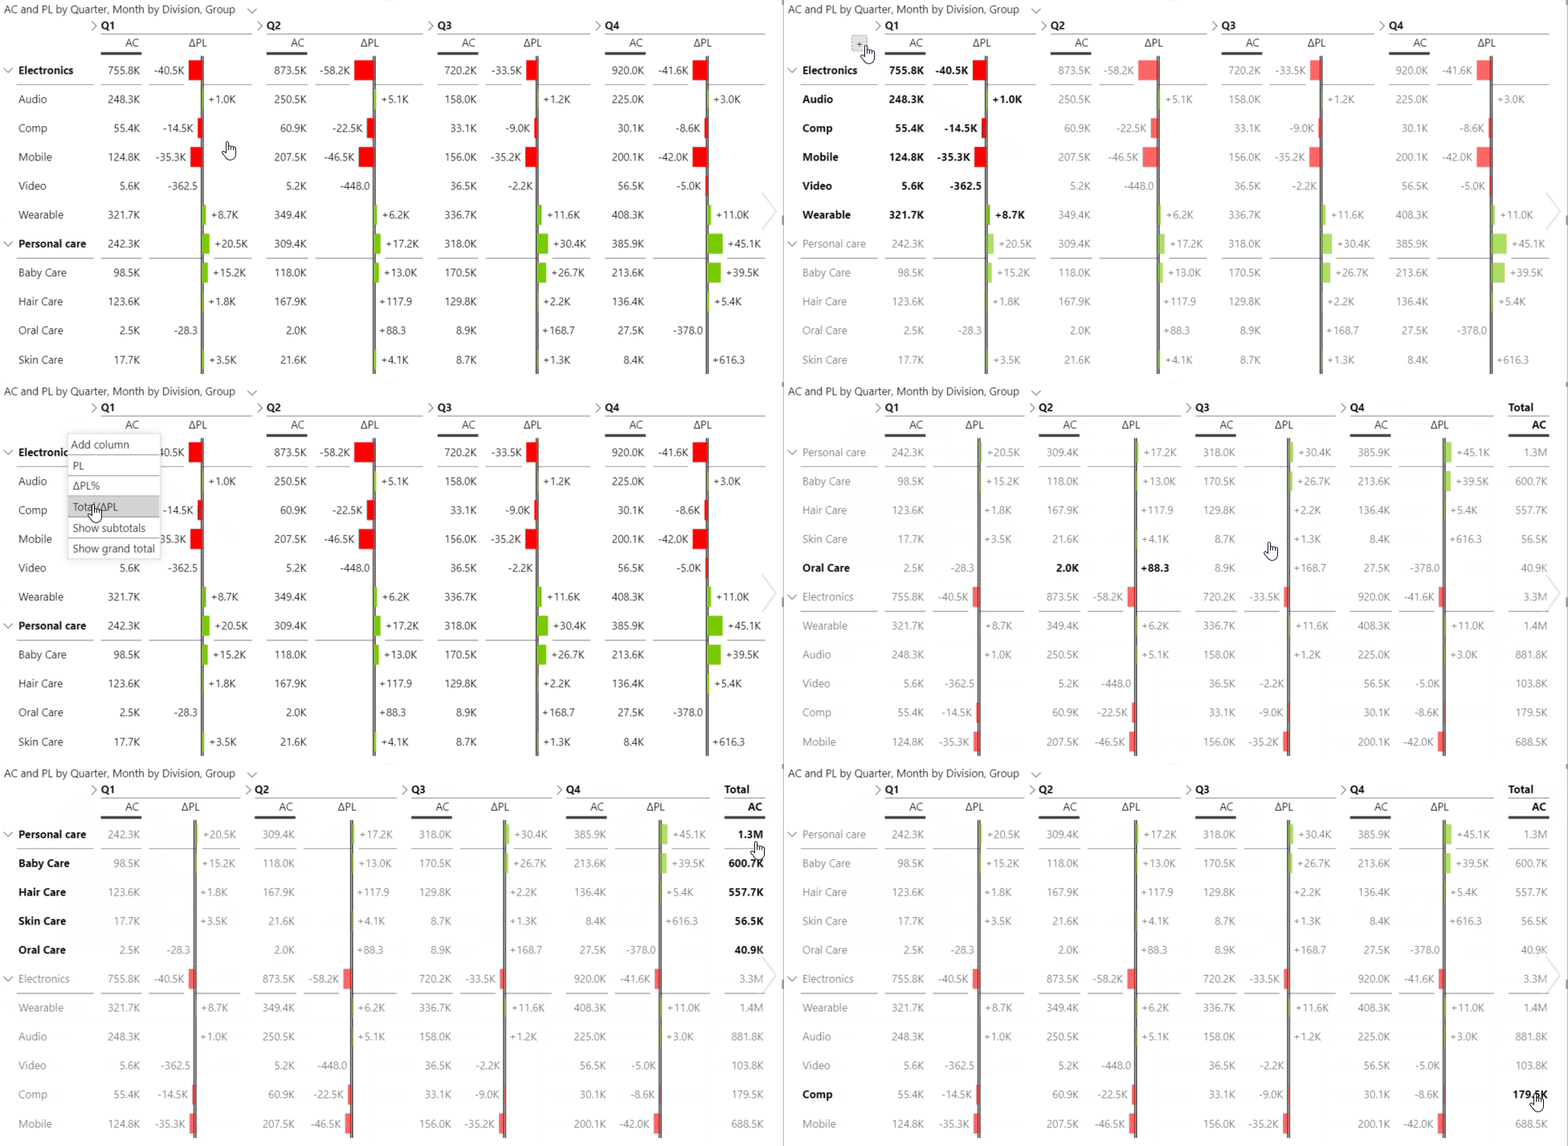
The name of the newly added column is Total but it can be easily changed by clicking the arrow next to it and replacing the name Total with the desired description.
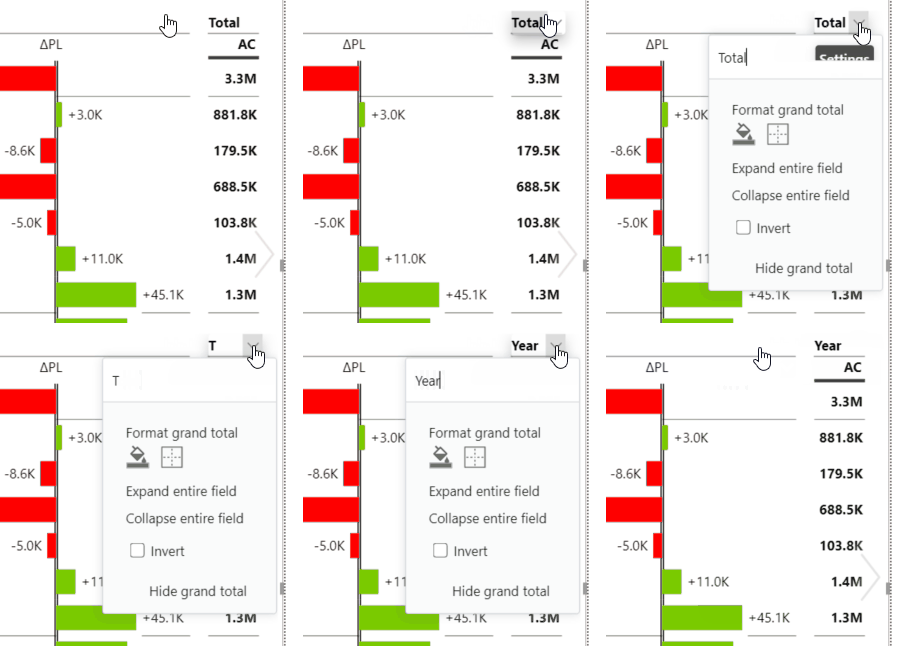
The grand total column can be hidden as any other column in Zebra BI Tables visual. Again, click the arrow beside the column and select the Hide grand total option.
Add subtotals to Zebra BI Tables
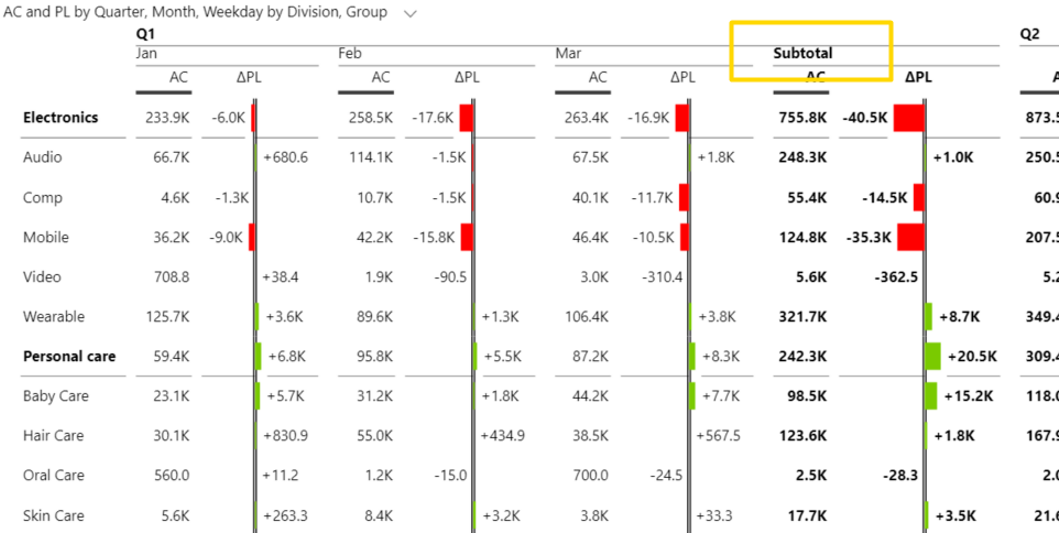
Now that we have the total for the year, you might also want to add subtotals for the quarters. In general, this option becomes visible when using hierarchy or multiple attributes in the Group placeholder.
To add subtotals, just hover over the plus (+) symbol in the top left corner of the visual and select the Show subtotals option.
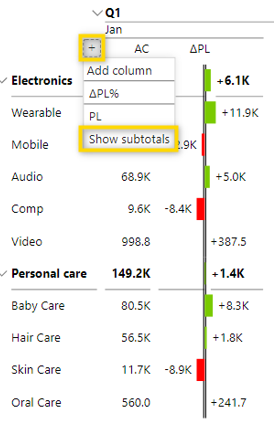
The subtotals for all sublevels of the hierarchy will now be visible. You can rename or hide the subtotals the same way as with the grand total.
Add Grand total to Zebra BI Charts
While we are on the subject, let us show you how to add a Grand Total on our Zebra BI Charts visual as well. Navigate to Format pane, expand Chart Setting and turn the Grand total On.
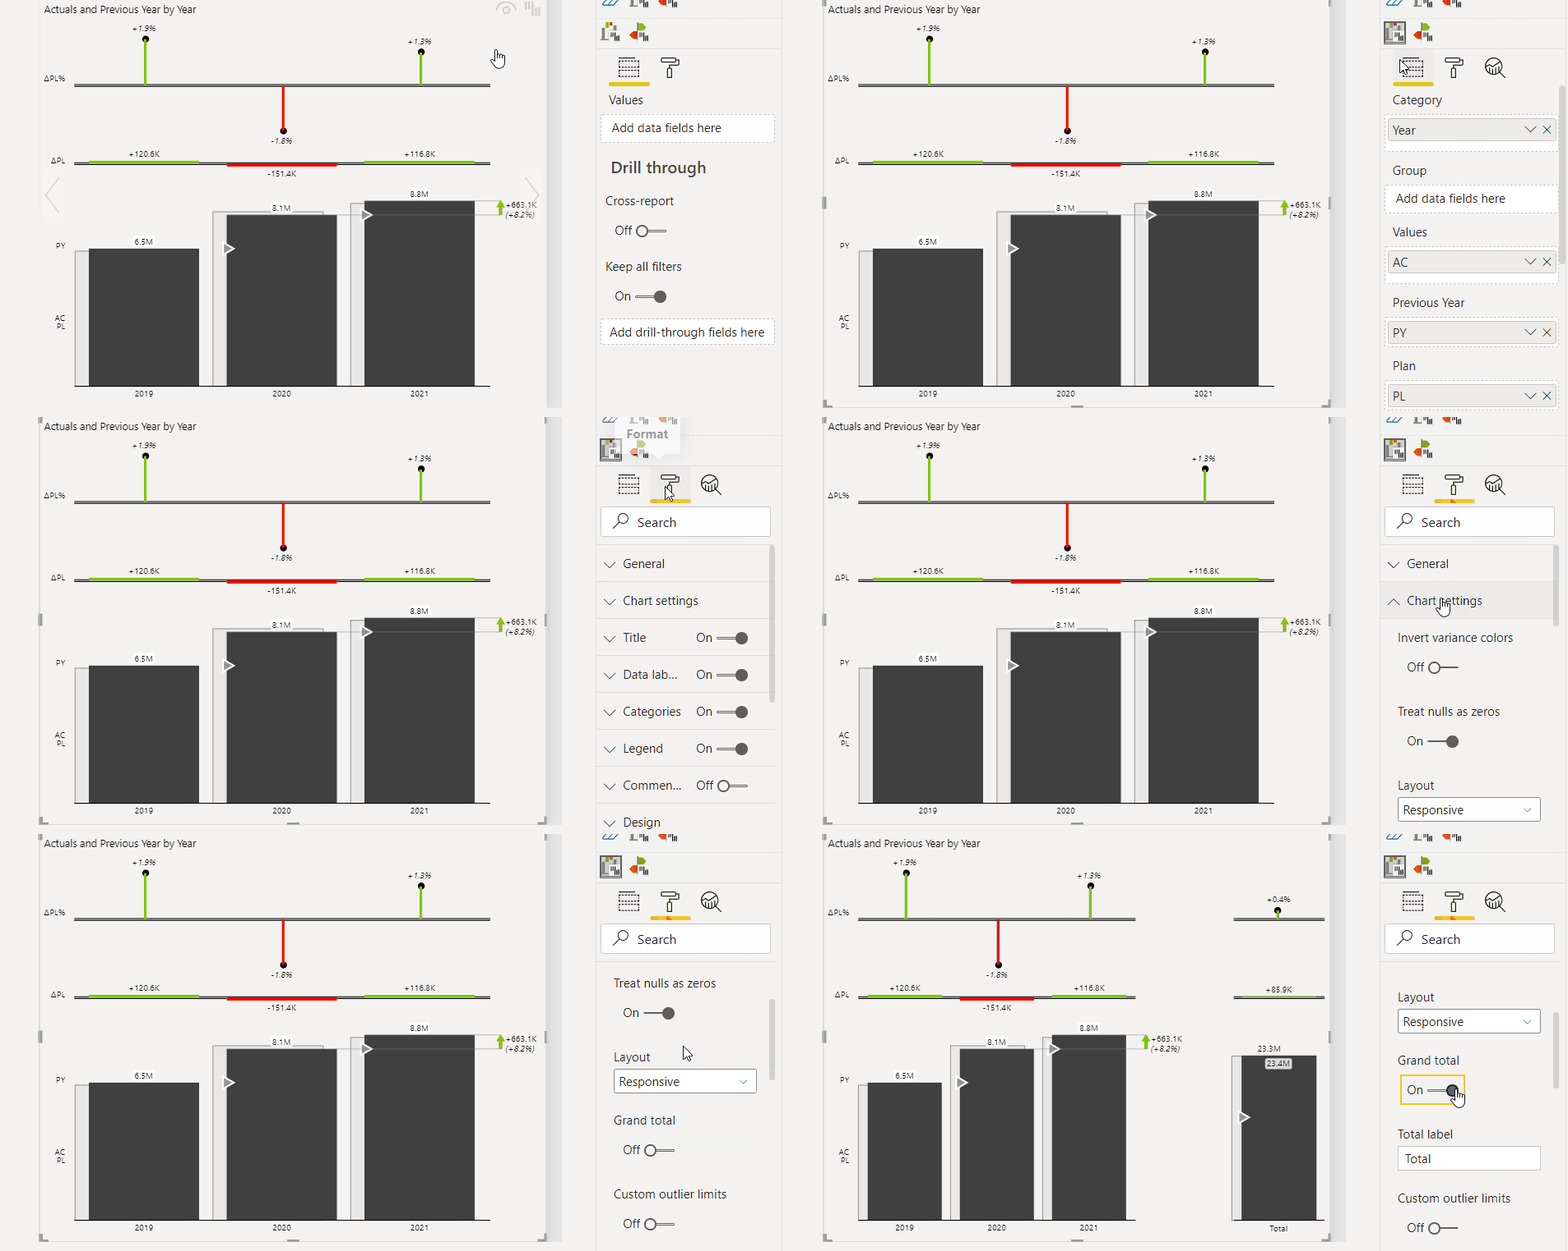
As you toggle the Grand Total to On, you will notice a Total label setting appearing. Use it to change the label below the Total bar.
Congratulations! You’ve just learned something essential for every report. Surely, the end-users will be delighted to see a well-rounded report with totals and subtotals.