In a report that contains many KPIs, it can be hard for the end-users to know exactly what each indicator means. To help improve the general understanding of each metric, you can add definitions as tooltips on the title of each card.
Learn how you can apply this feature and make your reports more understandable for the viewers.
⚠ Note: this feature currently (Zebra BI Cards 1.5 version) works only when there are no measures placed in the Category placeholder.
To apply the same functionality to your report with Zebra BI Cards, follow the steps below.
Step 1: go under ‘Data’ in your Power BI report with Zebra BI Cards. There you need to add the KPI description column to the dimension with the KPIs.
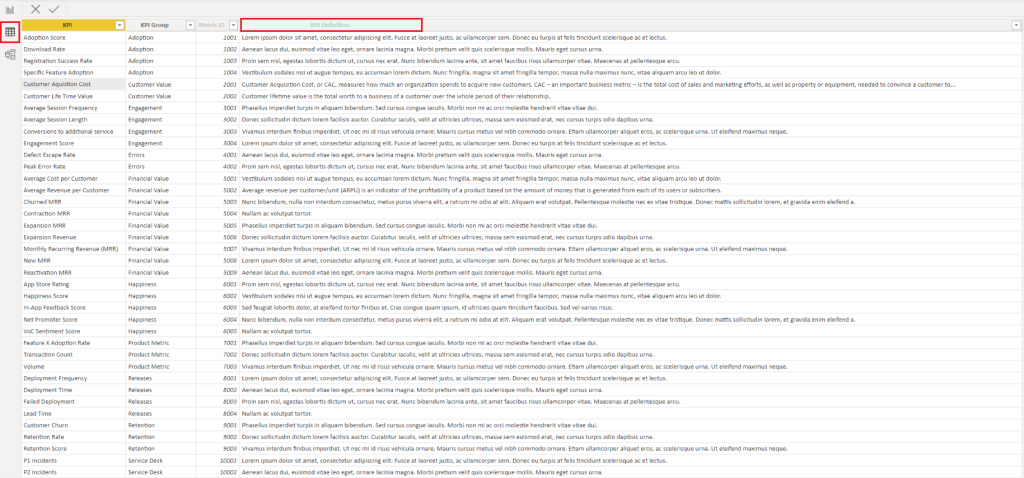
Step 2: once you added that, go back to the Report view. On the Cards settings, you will find a new placeholder bucket called KPI Definitions (just below the Comments). Simply drag and drop the KPI description field into the placeholder.
Once done, users can simply hover over the title on each card and read the description.
This feature was part of the December 2022 product update of Zebra BI visuals for Power BI.