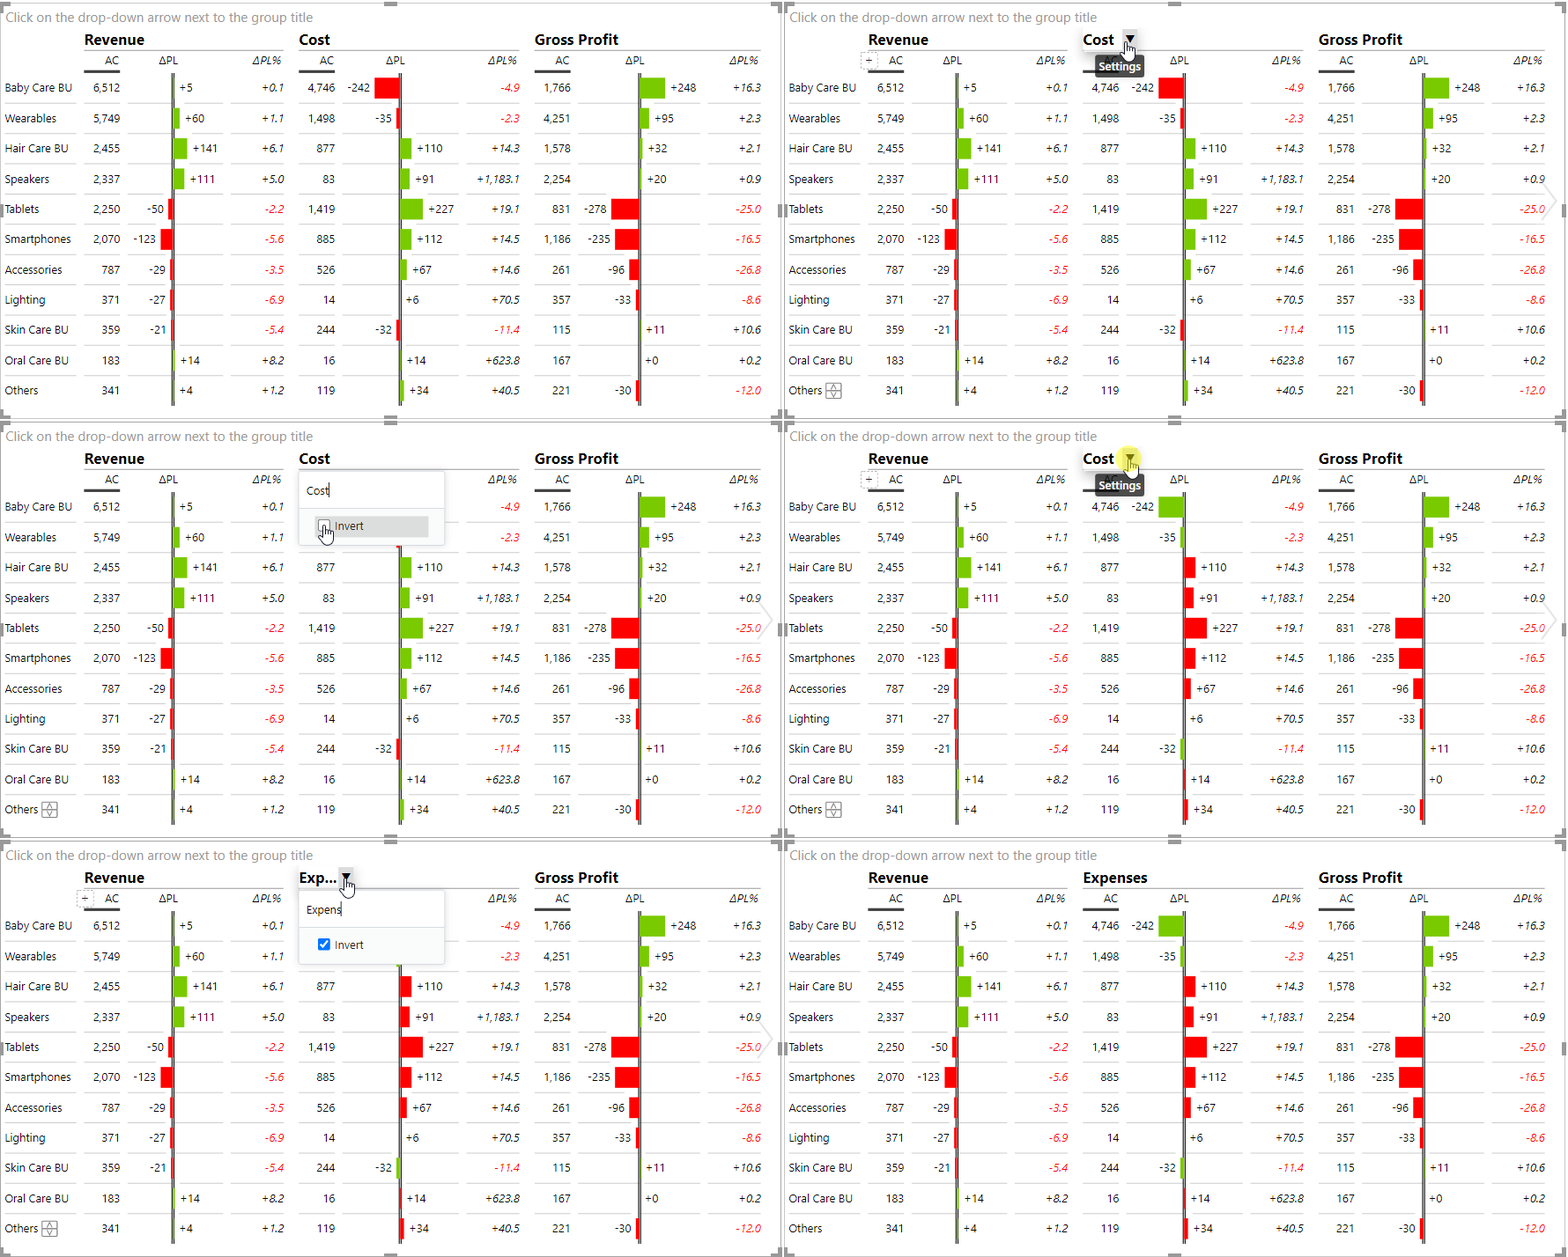
In a situation when you have different types of KPIs in your table, you can invert certain elements where that makes sense.
For example, if you’re showing Revenue and Costs within the same table, it has a completely different meaning whether the Revenue is growing versus if Costs are growing. Growing costs have a negative contribution to the end result.
Watch how to invert and rename groups in your tables in Power BI!
How to invert KPIs/Groups
Click on the down-arrow on the right side of the “Cost” measure and select “Invert”. That command will invert only the part of the table that relates to your costs.
Zebra BI will automatically change the colors to properly signal a positive versus negative contribution.

How to rename any of your KPI/Group
With Zebra BI Tables you can rename your KPIs or Groups directly within the visual.
Click on the name of your KPI and type in the new name. For example, you can change the name “Cost” to “Expenses”. Press Enter to confirm.
This is how you can now create tables where you have a lot of different KPIs with a mixed meaning (“good vs bad”) and you can do it all in just one simple Zebra BI Tables visual.
This feature was a part of the Zebra BI for Power BI 4.5 release.
Learn how to invert negative KPIs in Zebra BI Cards.