Display variances with arrows pointing up/down or left/right to better distinguish between positive and negative variances. This feature is very useful for people with color vision deficiencies because variances are not distinguished only by color but also by their shape.
Watch how to display Chevron Arrows in your Power BI reports
How to Display Chevron Arrows:
1. Navigate to the “Design” group of settings.
2. Find “Variance display type” and select “Arrow”.
You can also change the color of your chevron arrows by simply selecting the color of your choice for “Positive color” and “Negative color” in your Design settings.
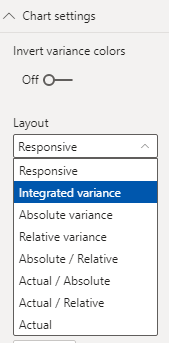
Note that chevron arrows are only possible to apply on so-called integrated variance charts. This chart layout can be selected in the Chart settings. In the Layout drop-down menu select Integrated variance.