In case you have empty values in your data, Zebra BI allows you to set a few strategies for handling them. You can suppress empty values, show empty rows in tables or empty columns in charts, and also decide whether you want the charts to display empty gaps or zero-based columns or lines.
Turn on the setting called Show items with no data
Turn on the setting called Show items with no data on your data field, like this:

This will result in missing months being displayed.
Let us have a look at a hypothetical business example. Due to the pandemic situation, our store was closed in April, May, and June, therefore no sales were made during that period. In terms of displaying sales results in a chart, this means that missing months will not be included but we still want to include them in the chart since this is also a relevant message in the sense of not achieving year-end sales goals.

By including missing months we also have a standard 12-months structure on the X-axis. This will make the comparison of this chart’s results to other charts, with a standard 12-months structure, much easier.
Turn the Treat null as zeros to Off in chart settings
(Off = no line for empty values, On = line at zero for empty values):

This setting is important when adding additional measures to a chart like Plan, Forecast, Target, Previous year, etc. Let us have a look at a typical example when we are displaying Actual results since the beginning of the year. Of course, we usually only have actual data for past periods, on the other hand, we normally have Plan, Forecast, or Target data available until the end of the year. Since Zebra BI visual automatically calculates variance between Actual and any other Plan data this will result in a chart like that:
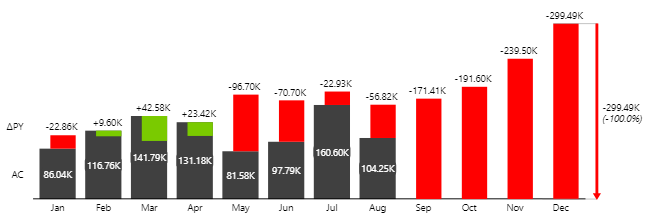
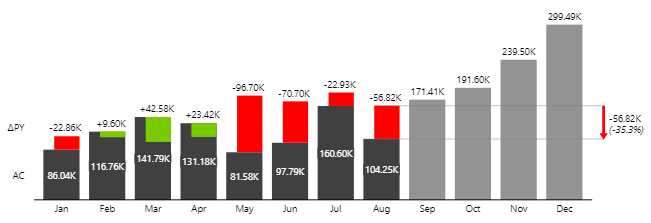
Since setting Treat nulls as zeros = On, calculation extracts Plan numbers from 0, resulting in a chart like on the picture above. Instead, we would prefer if Plan numbers will be shown in separate columns – Without variances due to extraction. For that, we must not treat nulls as zeros (Treat nulls are zeros = Off) so that calculation is not executed in this case. That will result in a chart like the one below where Plan data is presented as a standard series.
Did you know that if we would add another Plan (for example Forecast) to this chart Zebra BI will make a comparison between Plan and Forecast for months where Actual data is not available? Find more about it. →