Having your KPIs consolidated in a single dimensions table will enable the optimal use of our new Zebra BI Cards visual. Power Query approach is used in cases when your KPIs are not nicely prepared in one single table but rather scattered across various tables. Learn how to do it in 12 easy steps.
Preparing data article series
- Single card
- Basic Card with a single Excel table
- Power Query (more advanced)
- DAX/Switch (the most flexible)
Learn how to use a Power Query to consolidate data card
Download the PBIX example Mark used in the video.
Before we start, let’s have a quick look at our data model below.
We see two dimensions tables (Calendar and Product) connected to three different fact tables (Web, Finance, and Subscriptions) where the KPIs are located.
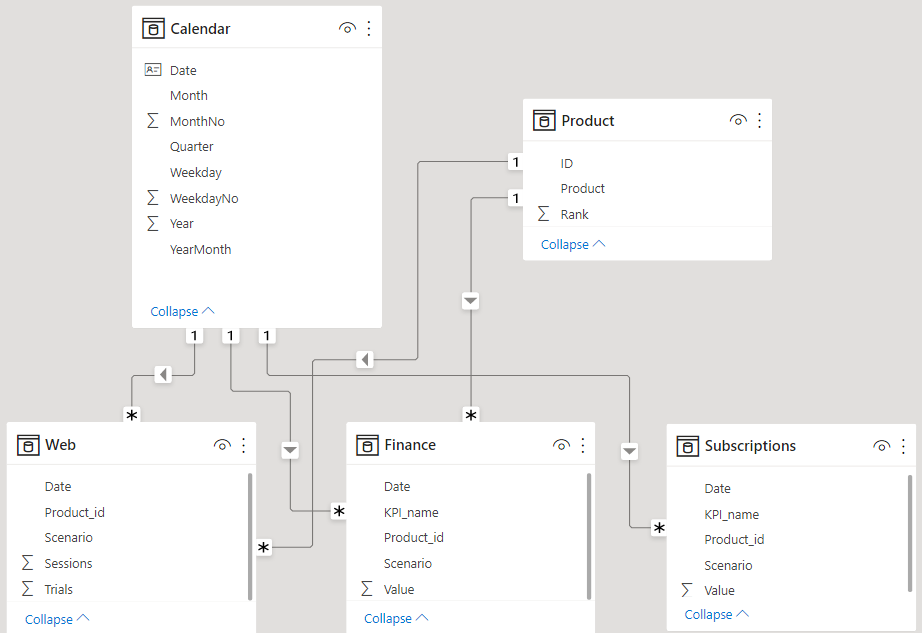
Looking at the three fact tables, we notice the Finance and Subscription tables are very much alike, containing the KPIs in a single column (KPI_name). In the Web table, however, the Trials and Sessions KPIs have their own dedicated columns.
The result of the following procedure is to have only one, unified fact table by joining (appending) the three fact tables together. To make this possible, we will need to transform the data model so all the fact tables will have the same structure, meaning they will contain the same columns with the same names.
First, we’ll join the two KPIs in the Web table into a single column, using the Power Query functionality.
Step 1: On the Home tab, click on Transform data.
Step 2: Open the Web tab on the left. To unpivot the data, select the Trial and Sessions columns, right-click and choose the “Unpivot Only Selected Columns” option. This will result in putting all KPIs to the Attribute column and values into the Value column.
Step 3: Rename the newly created Attribute column to KPI_name, effectively unifying the Web table structure with the other two fact tables.
Next, we’ll join all three fact tables into one new table.
Step 4: Under Queries (on the left) select all the fact tables, go to the Home tab, find the Append Queries dropdown menu, and click Append queries as new. This will create a separate table where all the data for KPIs will be consolidated.
Step 5: When the pop-up for Append options opens up, choose the “Three or more tables option”. From the “Available tables” window move the selected fact tables to the “Tables to append” window and click OK. This will effectively create a brand-new table.
Step 6: Now, you created a new fact table that contains the data from the three original fact tables called the “Append1”. Simply rename it to “Card KPI” or something similar.
As you now have all the needed information in one table, you can disable the data loading from them. The data will still be refreshed in the background, but it will not be loaded to the data model.
Step 7: To do that, right-click on the first table (in our case “Finance”) and uncheck the “Enable Load” option. When a window with a warning about Possible Data Loss Warning pops up, click Continue. Do the same with the other tables (in our case the “Web” and “Subscriptions” table).
Step 8: Once you repeat Step 7 for all the tables, click the Close & Apply button in the top-left corner.
Notice the data model changed? Besides the two dimension tables (Calendar and Product), only the consolidated fact table remains containing all three fact tables from the beginning.
However, they are not connected anymore.
Step 9: To ensure the connection, simply drag and drop the Date field from the Cards KPI table to the Date field in the Calendar table. A connection between the two tables should be established automatically. Finish the data modeling by dragging the Product_id and dropping it to the ID field in the Product table.
Now we are ready to create new measures for different scenarios, the last step before visualizing the data.
Step 10: On the right side go under Fields > Cards KPI table and click on any field. Go to the table view and click New Measure in the Table tools toolbar. There you can write your code for the new measure, or find an example of creating a simple measure for AC below:
AC = CALCULATE(SUM('Cards KPI'[Value]),'Cards KPI'[Scenario] = "AC")
To add more measures, copy the existing measure, click on New measure in the toolbar, paste the formula and adjust it to another measure, e.g., the plan or forecast:
PL = CALCULATE(SUM('Cards KPI'[Value]),'Cards KPI'[Scenario] = "PL")
FC = CALCULATE(SUM('Cards KPI'[Value]),'Cards KPI'[Scenario] = "FC")
A trick for you: if you want to easily find and replace something in DAX, select the element in your formula (e.g., AC), simply click CTRL + Shift + L and put in the new phrase (e.g., PL, to easily adjust the formula to a new measure).
Congratulations, you’re all set!
The only thing left is to visualize the data with the Zebra BI Cards visual.
Step 11: Switch to Report view and add the Zebra BI Cards visual. Start adding the dimensions and comparisons placeholders.
For example, add the Month from the Calendar table to the Category placeholder. Add the AC measure to the Values placeholder, PL to the Plan placeholder, and FC to Forecast placeholder as comparison measures.
To finalize the visualization, add the KPI_namedimension to the Group (KPIs) placeholder.
As we are done, we find all the KPIs displayed in a single Zebra BI Cards visual.
Great job, now you know how to consolidate your data with Power Query to present your KPIs nicely in one visual!
Furthermore, each card can be formatted, resized, reordered, and further enhanced using a wide variety of options.
Learn more about Zebra BI Cards formatting options.
Get an overview of Zebra BI Cards visual.
The Power Query data preparing approach might be adequate, but ultimately it may lack the necessary flexibility for even more in-depth analysis. This is where we turn to DAX (Data Analysis Expressions) language, namely the SWITCH function, to demonstrate the most complex and powerful data preparation approach.