Setting up a proper data model is the first step in developing a good Power BI Report. Following some best practice standards makes this even easier. The following article contains a couple of best practice rules which will make it easier for you to work with Power BI. We suggest you try to implement them in every report you create, so they become second nature.
Of course, you should always try to get a proper Star Schema data model. Learn more about the
Star Schema.
Hide foreign key
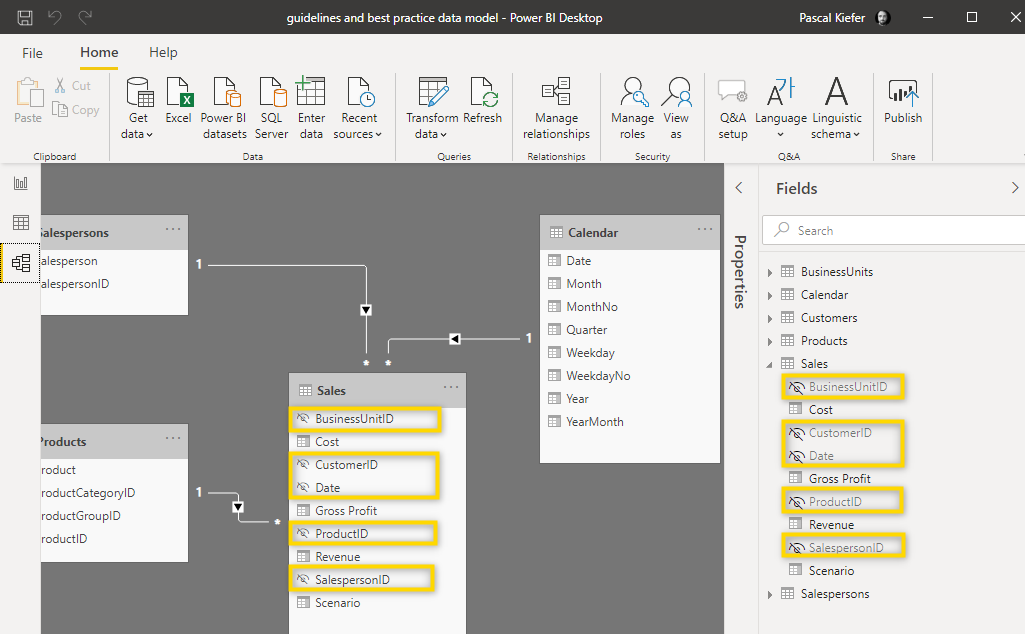
What is a foreign key? In your data model, you create relationships between a
Primary Key and a Foreign Key. An example of that is demonstrated below.
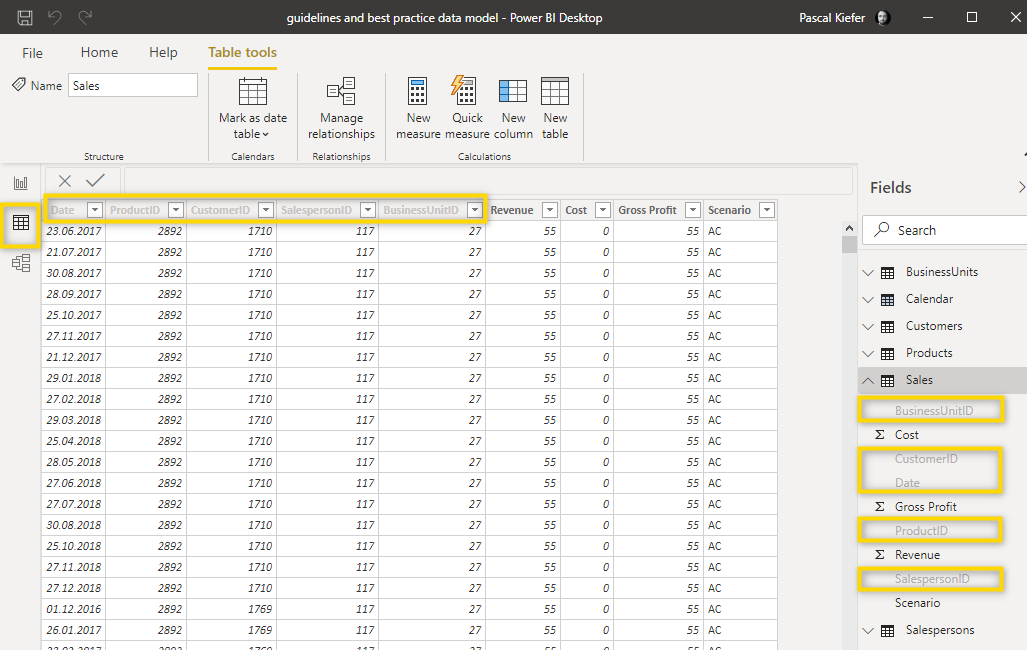
In the Salespersons table, you have a list of all Salespersons of your company. Each person is listed exactly one time, so you have unique values. This is your
Primary Key.
In the Sales table, a Salesperson could have multiple sales or no sales at all. This is the
Foreign Key.
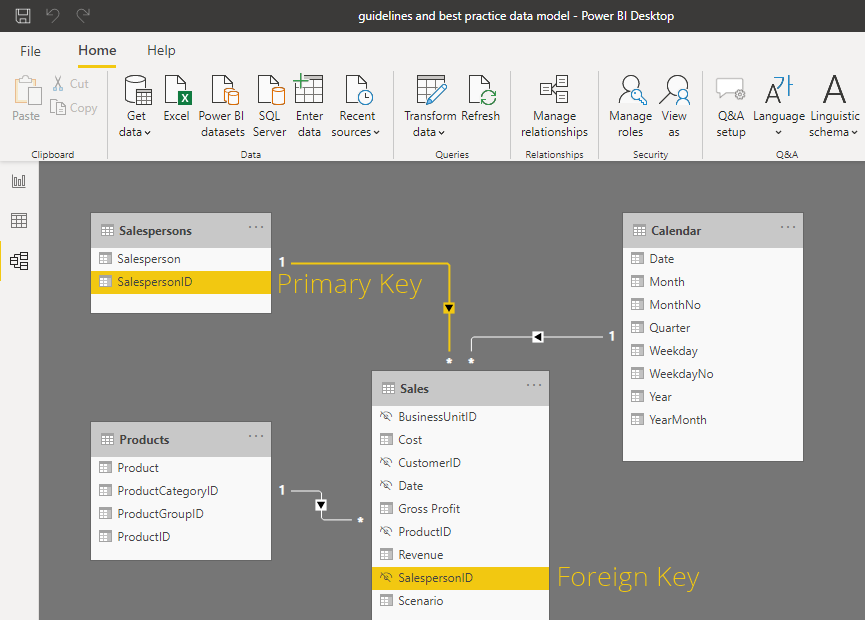
As you can see, the Primary Key is in the Lookup Table and is the one used in visuals and slicers/filters. The Foreign Key should not be used in the Report View and should therefore be hidden.
Hide fields that are not needed
Hiding a field means that it’s still loaded into the data model and can be used in calculations. When you hide a field, it’s only hidden in the Report view but can still be seen in the Data and Model view.
How do you decide which fields you should hide?
First, you should ask yourself if the field you are considering to hide is needed in any visual, calculation or relationship. If the answer to this question is no, then you should consider deleting it from the data model. This will reduce the size of your model and might have a positive impact on performance.
⚠️ If you delete a field by accident, you can get it back by removing the applied step in Power Query Editor.
If the field is needed in a visual, calculation or relationship, you can’t delete it. But you might still want to hide it. Below are our guidelines when it is usually better to hide them or leave them visible.
- The field is only used to create a relationship between tables but shows the ID (i.e. ProductID) of a dimension while in the report, you will always show the Description (Product Name) > Hide.
- The field is purely technical and is only created for some calculations > Hide.
- The field is only used for a custom sort order > Hide.
- Have you created a measure that shows the same result as the actual value column? (i.e. The Column Costs can be hidden once you have a measure that calculates the costs) > Hide.
- The field is used in a visual > Don’t hide.
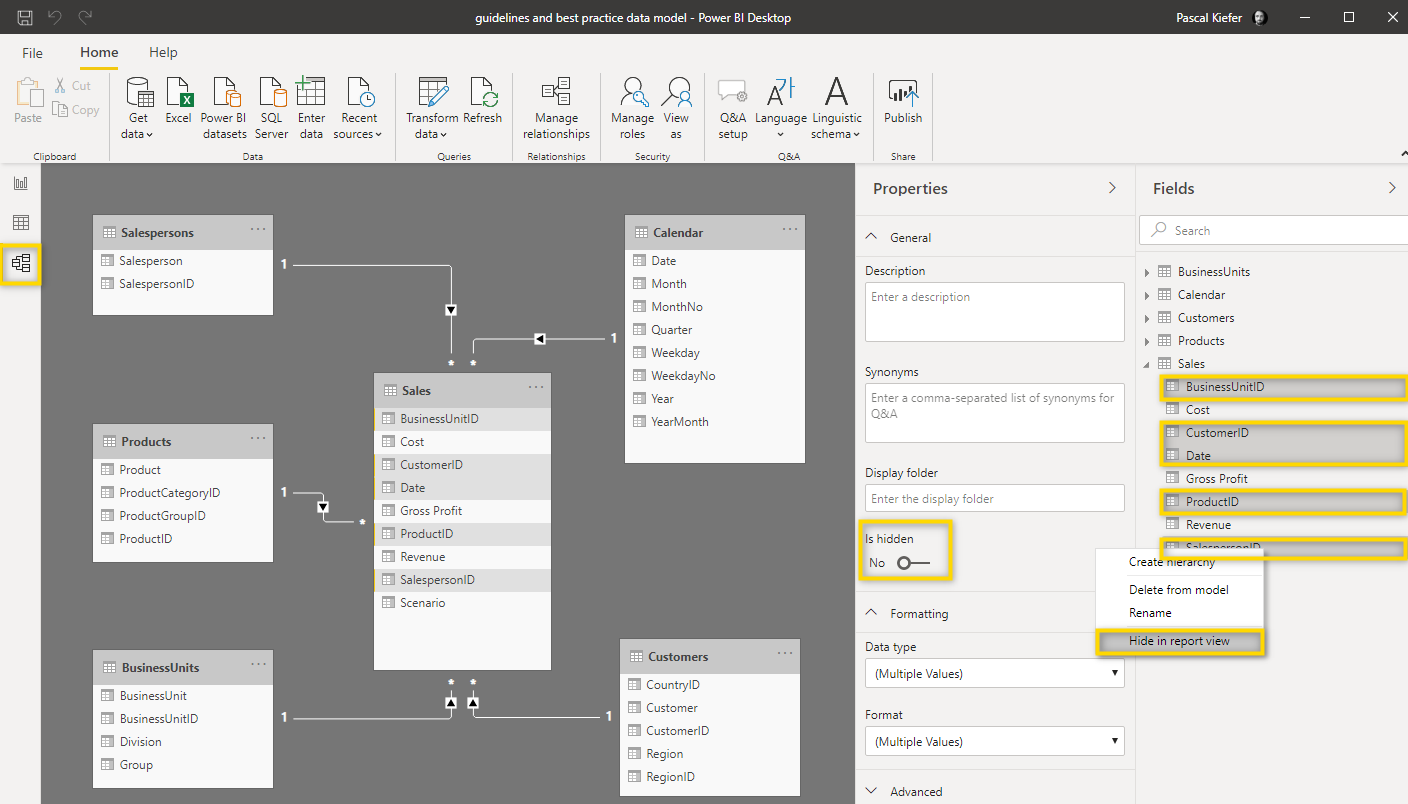
You can hide a field by right-clicking it and select Hide or Hide in Report View. Depending on the view you are currently in, the Menu looks a bit different but you can hide a field from each of the views).
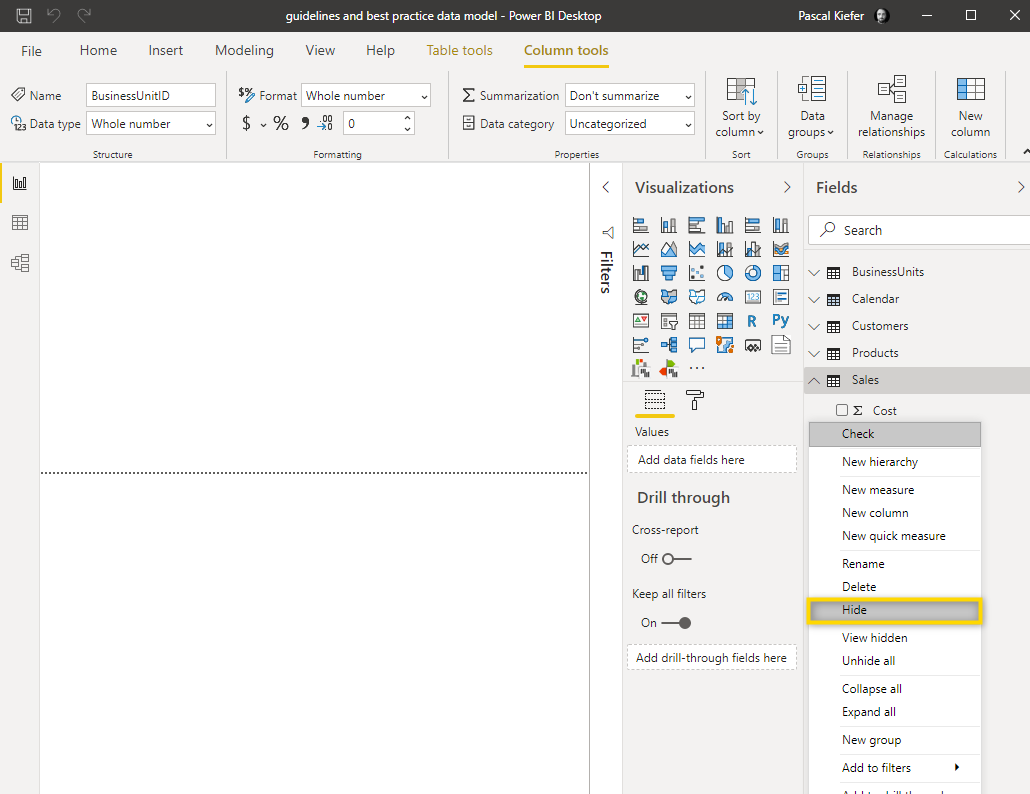
In the following example, some fields from the Sales table are hidden and each view displays that differently:
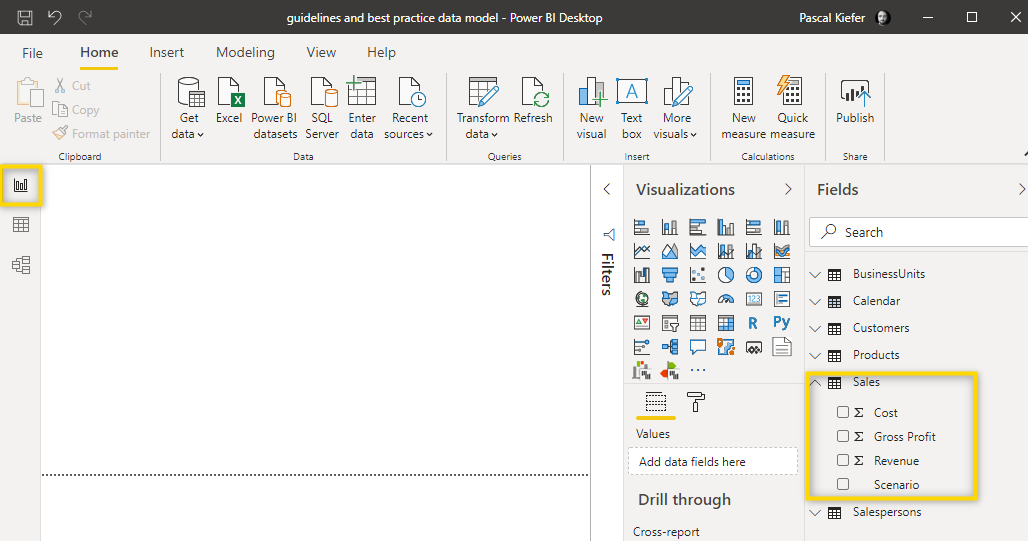
- Report View: The hidden fields can’t be seen which prevents the user from accidentally adding the field to the report (Which is one of the main reasons why we want to hide fields in the first place).
- Data View: The hidden fields are still shown but are greyed out.
- Model View: The hidden fields can still be seen but an icon indicates that the fields have been hidden in the report view.
You can also hide multiple fields at the same time. To do that, go to the Model view, select the fields you want to hide (using Ctrl or Shift to select multiple items), right-click, and select Hide in report view or turn the Is hidden property to Yes.
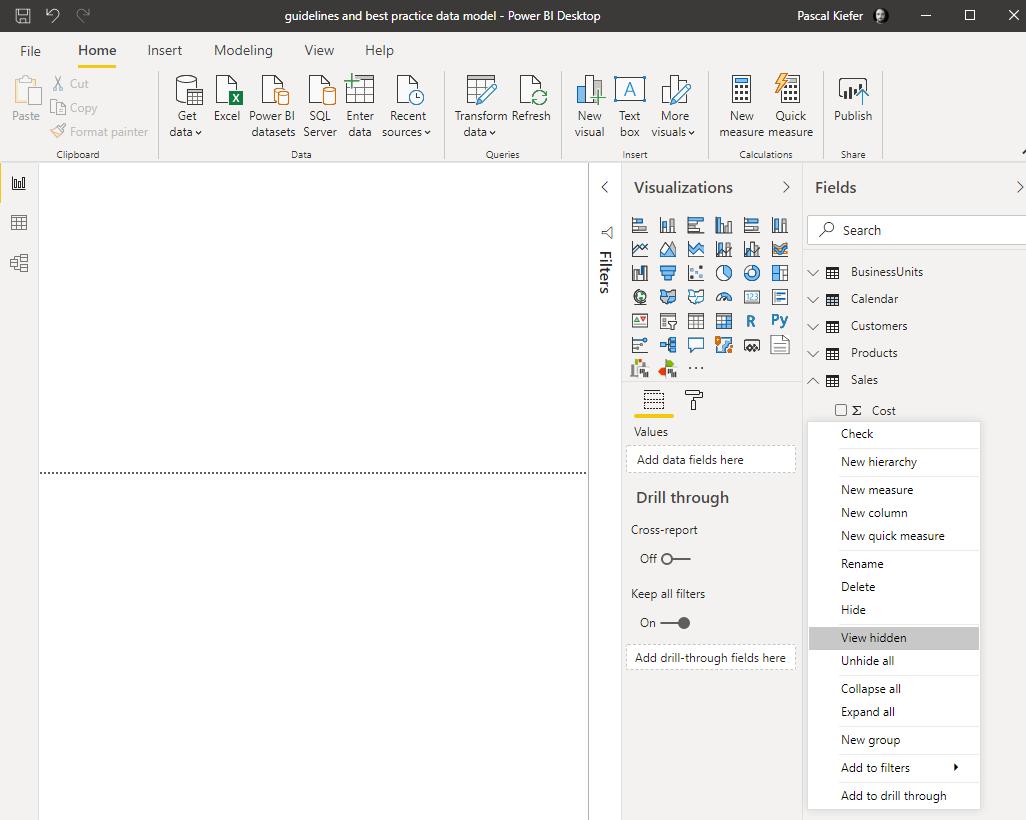
⚠️ Hint: If you want to temporarily show all hidden fields in the report view, right-click anywhere in the Field list and select View hidden. While doing this, be careful not to select Unhide all because unfortunately, by the time of writing this, this step can’t be undone and you would have to manually hide all fields again. Hopefully, this will be fixed in a future update of Power BI Desktop.
Arrange tables
There’s no one right way of arranging your tables but there are many wrong ways. When creating more complex Power BI Reports, you can end up having 20, 30, or even more tables in your model. So it’s very important to tidy up the Model view to keep an overview.
Below we’ll compare a clean model to a model where tables haven’t been arranged nicely:
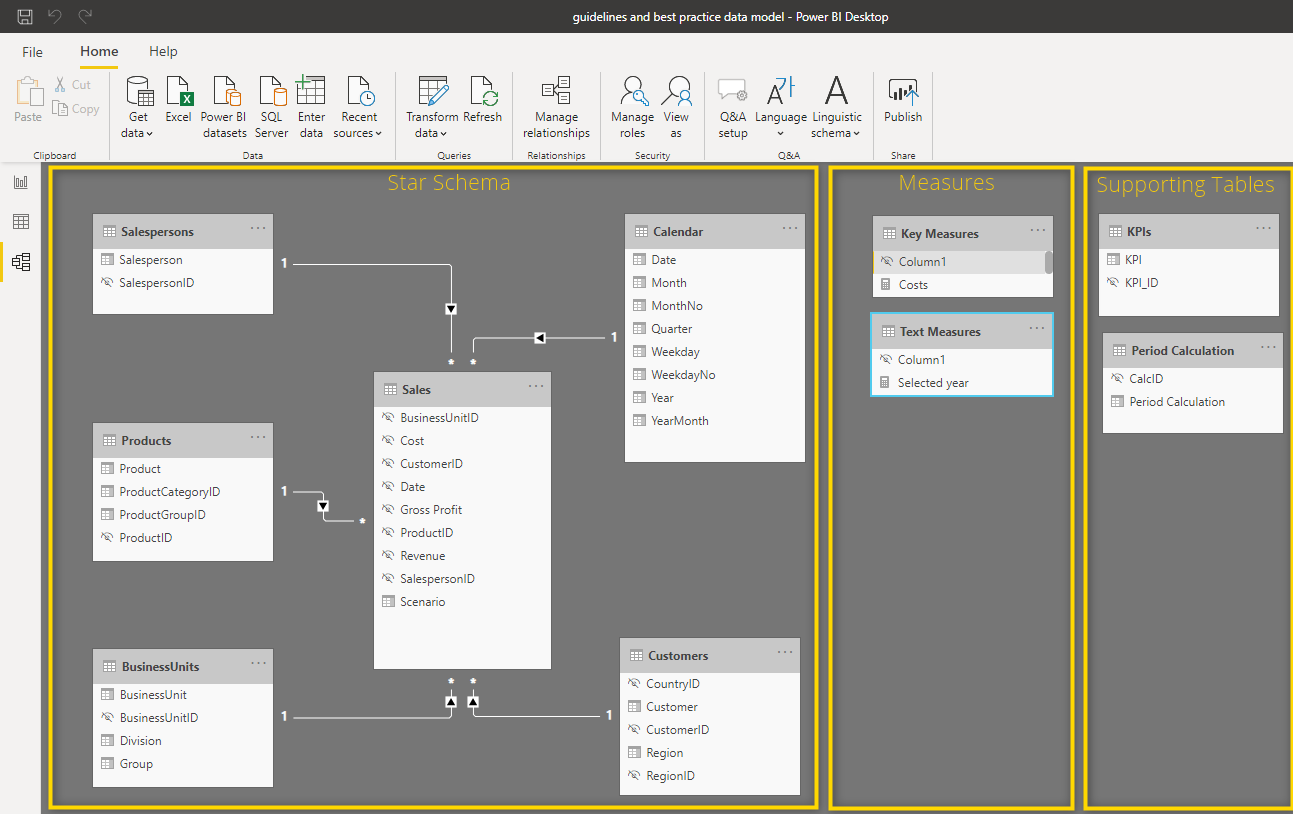
In this model, the actual data model is arranged in a
star schema and is on the very left. Next to it are all the Measure tables and then all other supporting or technical tables. This way, it’s easy to keep the overview:
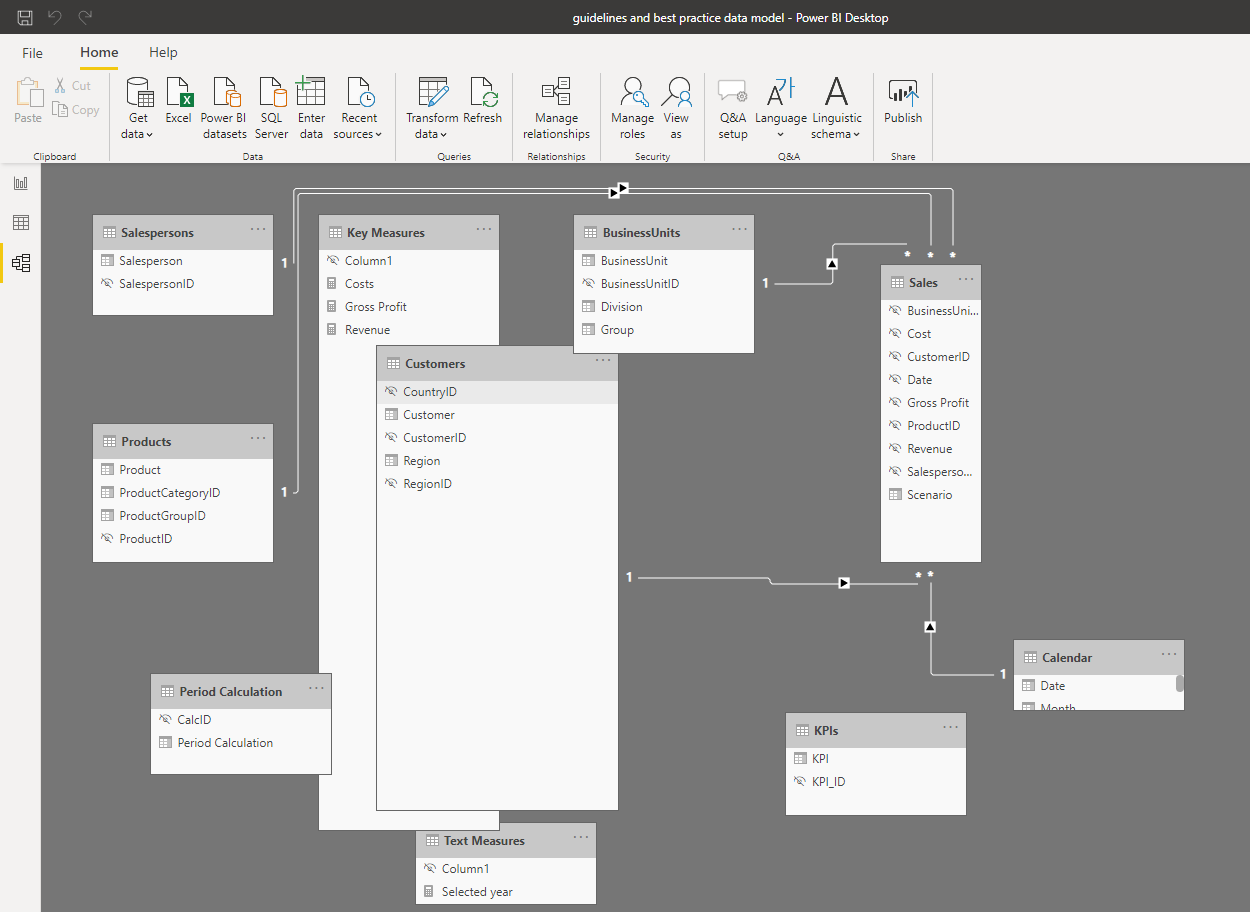
Below is exactly the same model, but without a neat structure. It’s impossible to easily see what’s going on:
Organize measures in folders
Often, you end up having a big number of measures in a report. To still have the overview, you can organize measures in folders. To create and manage folders, you need to go to the
Model view.
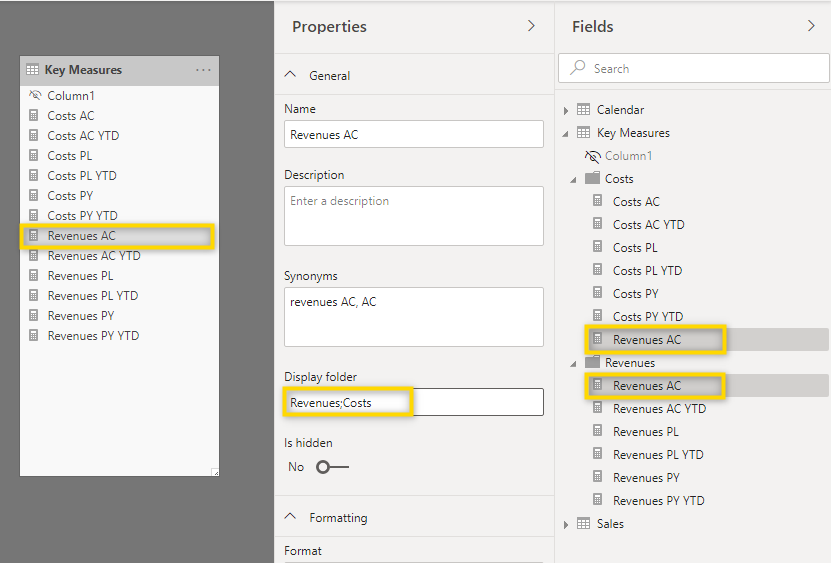
Select the Measure or Measures (press Ctrl on your keyboard to select multiple Measures) you would like to add to a folder. Then type the name of the folder in the Display folder box in the Properties view.
Once a folder has been created, you can also use drag and drop to move measures in between folders.
You can also allocate a measure to more than one folder. To do this, add multiple folder names into the Display folder field separated by a semicolon.
Create Measure Tables
In order to have a neatly structured report and keep your data model organized, it’s best to organize measures in separate tables. See below how to create dedicated Measures Tables:
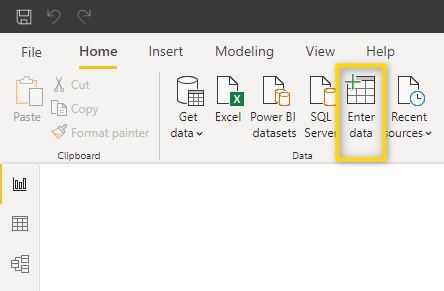
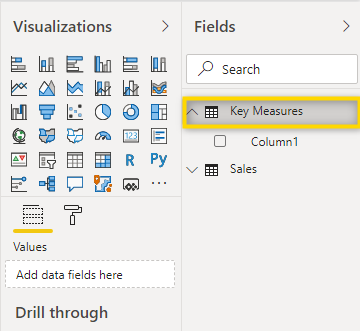
1. Add a new table.
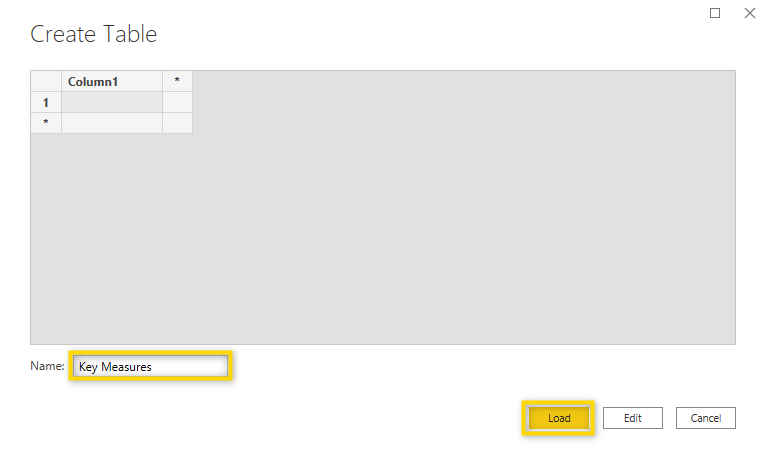
2. Name the table and load it to the report. Note that the table can not be called Measures as this name is reserved by Power BI. You could use Key Measures instead.
3. The new table has been added to the report.
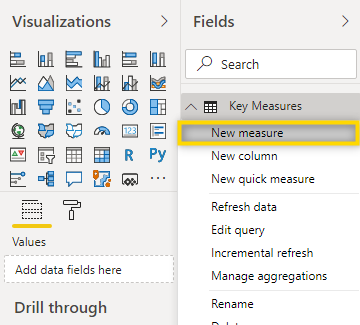
4. To allocate a new measure to this table, right-click on the table and select New measure.
5. Add the DAX function to the formula bar and confirm with the Enter key.
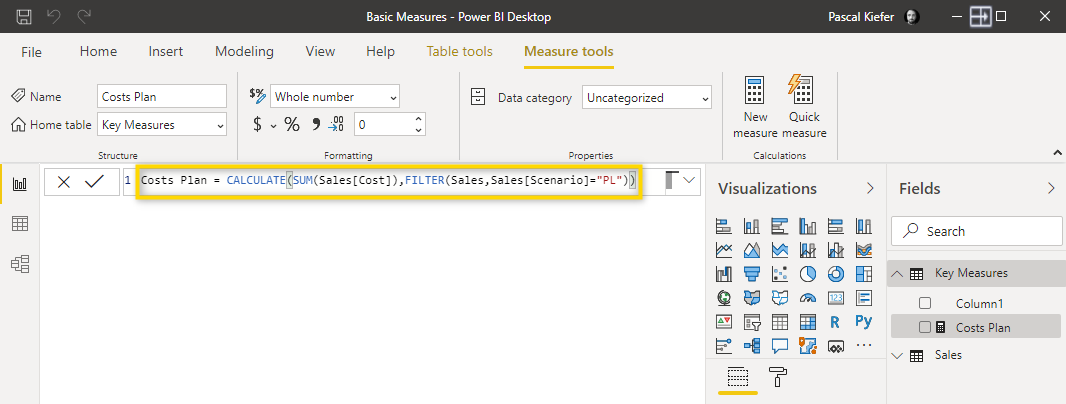
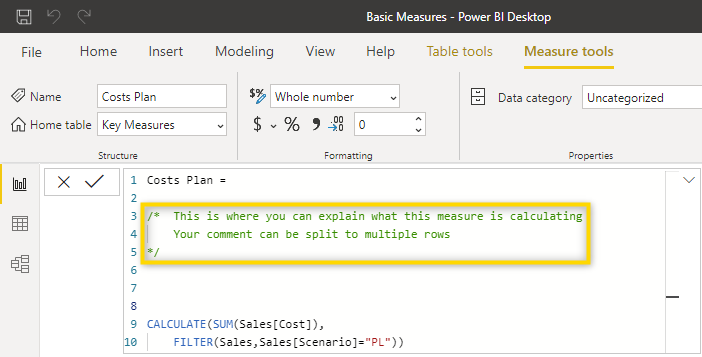
The Key Measures table now contains a newly created Costs Plan measure.
6. In order to turn the new table into a pure measures table, right-click the column which was automatically created when you added the table and select Hide. It’s better not to delete the column as this might lead to issues.
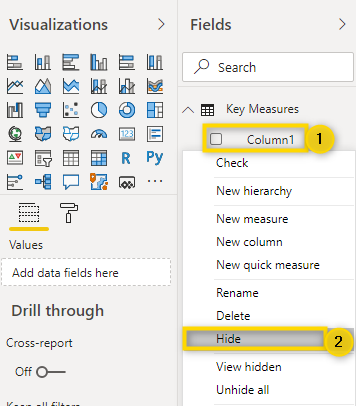
⚠️ Hint: In case you want to show hidden columns, use the option View hidden.
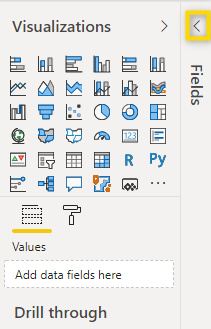
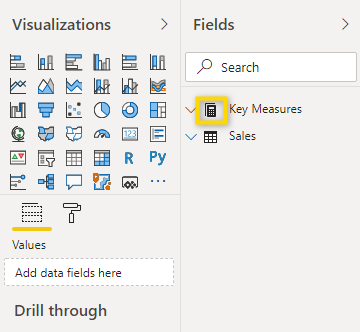
7. Hiding and showing the Fields pane turns this table into a measures table which is indicated by the changed icon. Measure tables are always on the top in the fields list which makes it easier to find them.
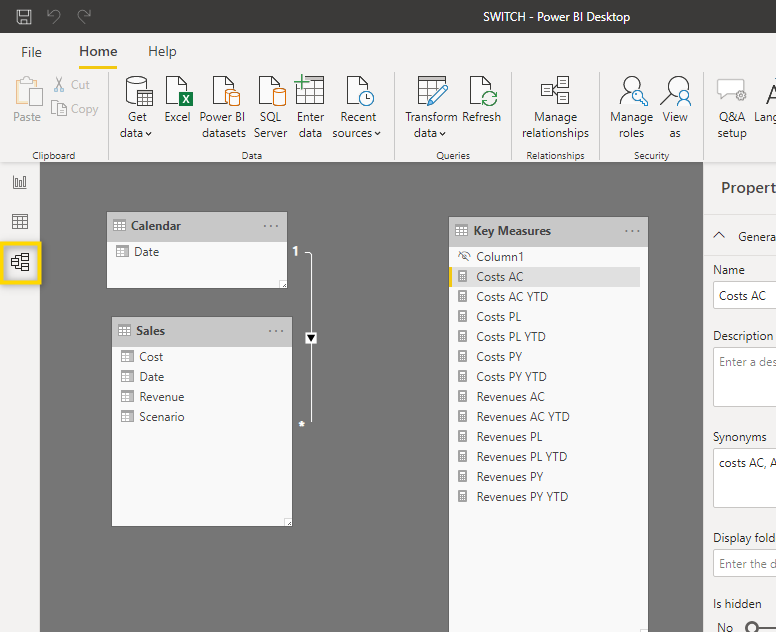
Depending on the complexity of the report, you might end up with multiple measures tables.
Format DAX Measures
DAX measures can become quite complex. To still be able to read complex DAX functions, you should consider adding some formatting to the formula in order to increase readability. There are 3 formatting elements that can be used:
1. Add line breaks. Use Alt + Enter to add a line break to your DAX.
2. Indent to create structure. Use the tab key to indent a row.
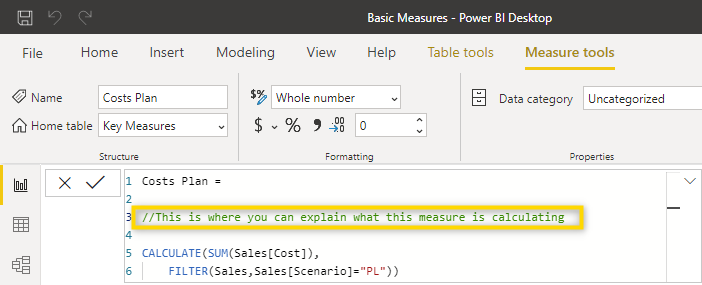
3. Add comments. For more complex DAX measures, you can add comments to explain what the measure is calculating. If you have a short comment, it can be added starting with //.
If you need to write a longer comment, you can start the comment with /* and end it with */ .