With the 5.2 update, most of the settings in Zebra BI Tables and Charts visuals can be bookmarked. This will save you a lot of time and enable report viewers to simply switch to the view that suits their needs best.
Bookmarks are an integral part of creating reports and dashboards as they enable you to simply select and save the settings for the desired view and return to it whenever it’s needed. With the 5.2 update of Charts and Tables visual, we now enable also the bookmarking for almost all advanced features, e.g., report page tooltip, dynamic comments, etc.
What can be bookmarked and how to do it?
Zebra BI Charts bookmarks
- Change chart type.
- Apply different Chart settings: layout, show grand total, show vertical axis.
- Comment box: you can create a special view where you can decide to turn off or on the comment box.
- Highlight differences.
- Add or remove axis break.
- Data labels: simply adjust the units, decimal places, density, and percentage decimals for different views to customize better your reports and dashboards.
- Style: add an option for people with color deficiency to make your report more accessible or change other design options.
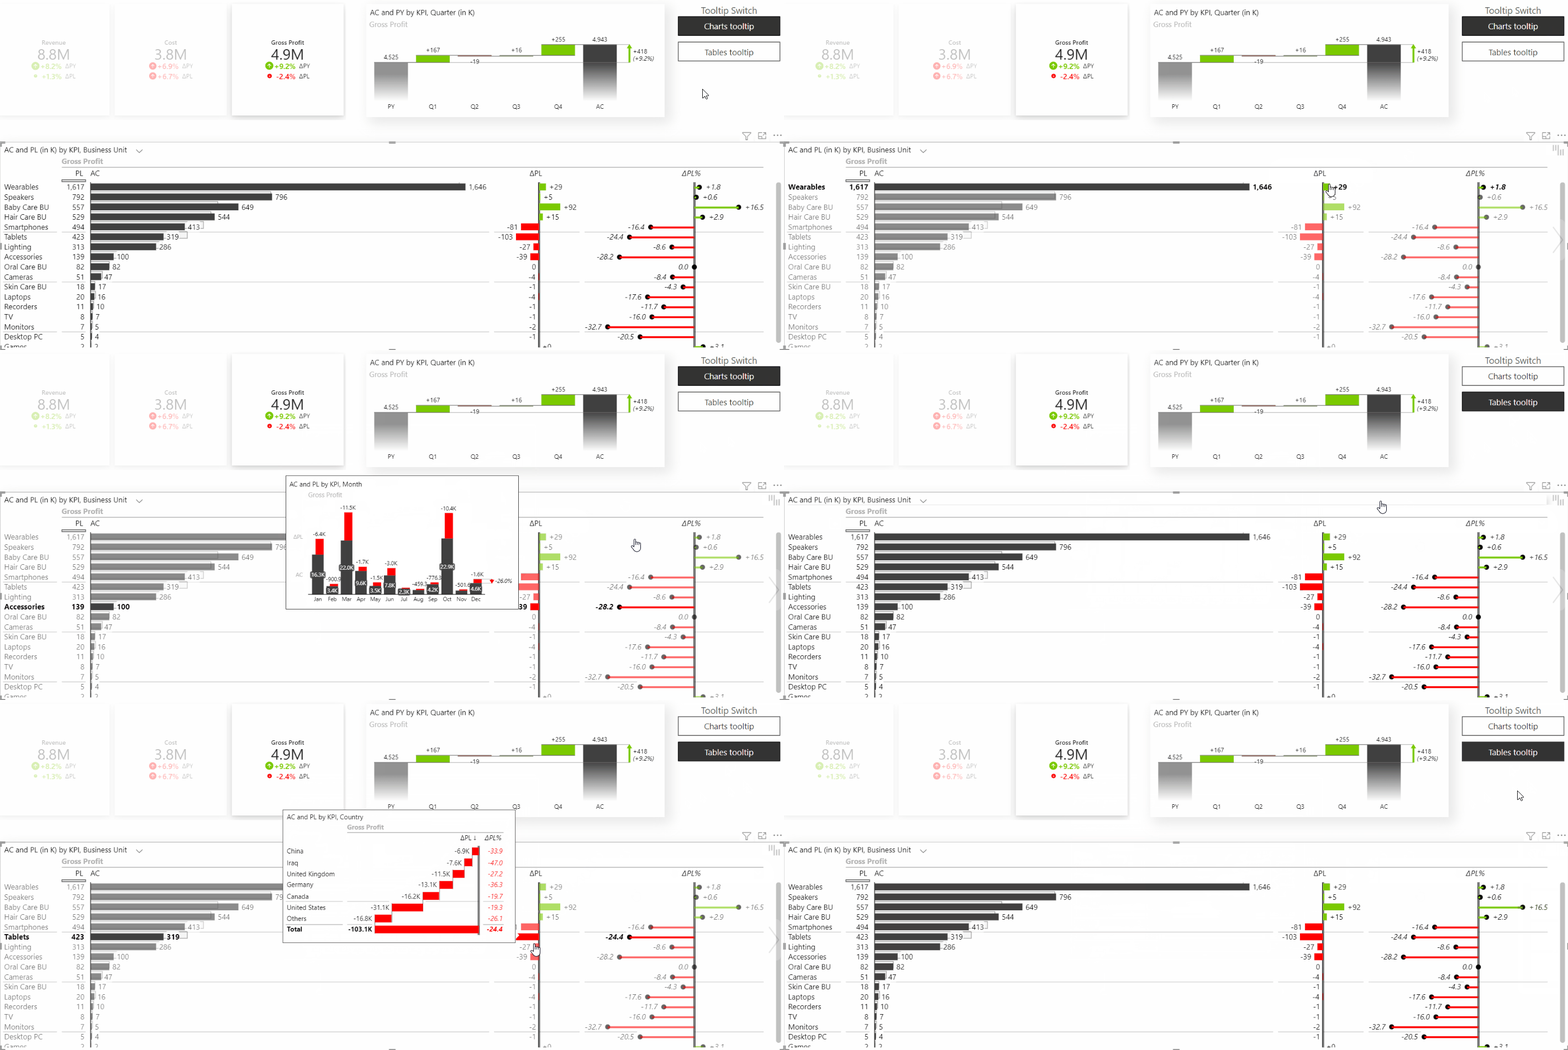
- Tooltip: you can now compare several views within one visual by simply clicking on the report page tooltip and selecting between different options (example below shows having Charts and Tables tooltip within one report page).

Zebra BI Tables bookmarks
- Title: you can change the title, save it as a bookmark and link this bookmark to a button in your report. This way, when a user clicks on this button, the saved title will show up.
- Column names: you can rename the default column names and save that as a bookmark.
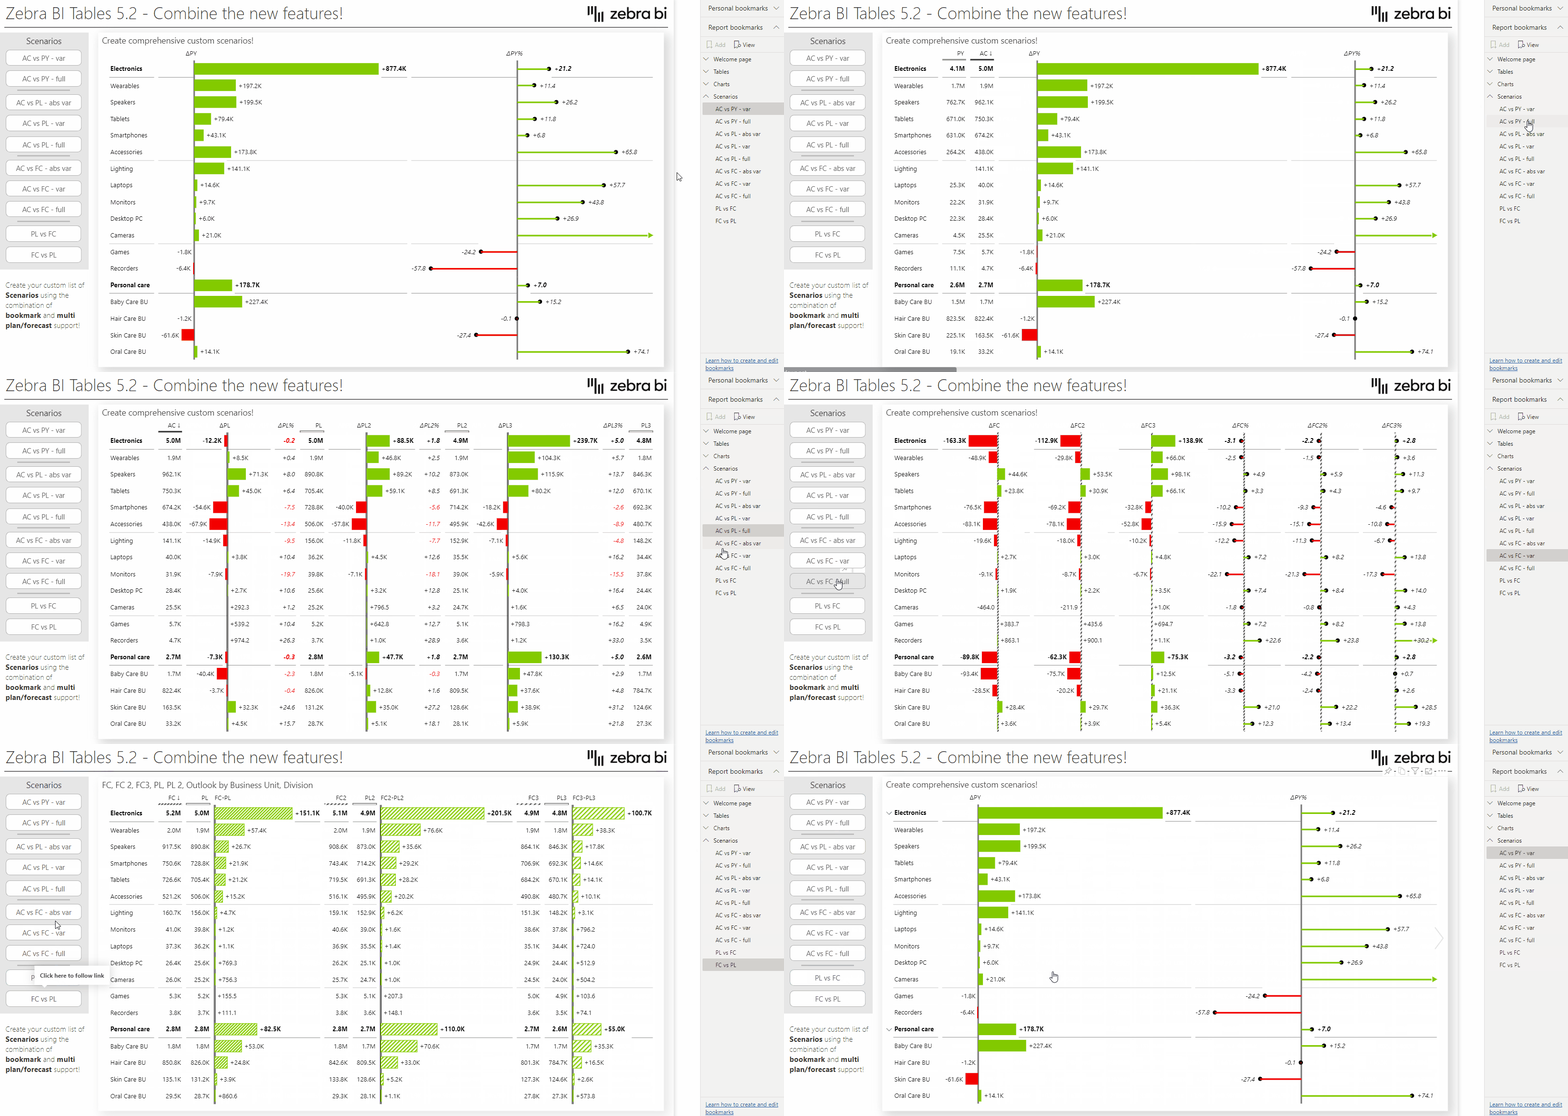
- Layout: with just one click on a button of a bookmark, you can completely change the layout of your Tables visual. For example, display only actual values or just variances.
- Style: you can add custom colors in a separate view or create a bookmark specifically for people with color deficiencies which will help them see the report more clearly.
- Comment box: you can create a special view where you can decide to turn off or on the comment box.
- Data labels: simply adjust the units, decimal places, and percentage decimals for different views to customize better your reports and dashboards.
- Tooltip: you can now compare several views within one visual by simply clicking on the report page tooltip and selecting between different options.
For more advanced usage of Zebra BI Tables visual, you can combine the new features of the 5.2 update. This way, you can track multiple plans and forecasts against the performance and save different typical business scenarios with bookmarks, so you can have several report pages within one visual.

Familiarize yourself with detailed instructions on how to create insightful report bookmarks in Power BI. →