Data Labels are used for describing data insights, as such, they are an integral part of every chart, table, or report and if used correctly they are a very strong story-telling element that makes your reports more relevant. Yet data labels are often neglected and used in the wrong way by report designers.
Zebra BI understands the importance of data labels that is why it uses advanced calculations and algorithms in order to automatically display labels in the best way possible. Time-saving and consistent labeling design are two instant benefits of this approach. Additionally, a lot of useful features are also available to display data labels in the best way possible.
You can select many different units for displaying data labels. This can be very useful when dealing with large numbers. You can also choose between displaying units next to a data label (example: 335.7K) or moving a unit selection to the chart title (example: Revenues and PL by Month (in K). The first option is perhaps easier to read, the second one can be useful in case of limited reporting space.

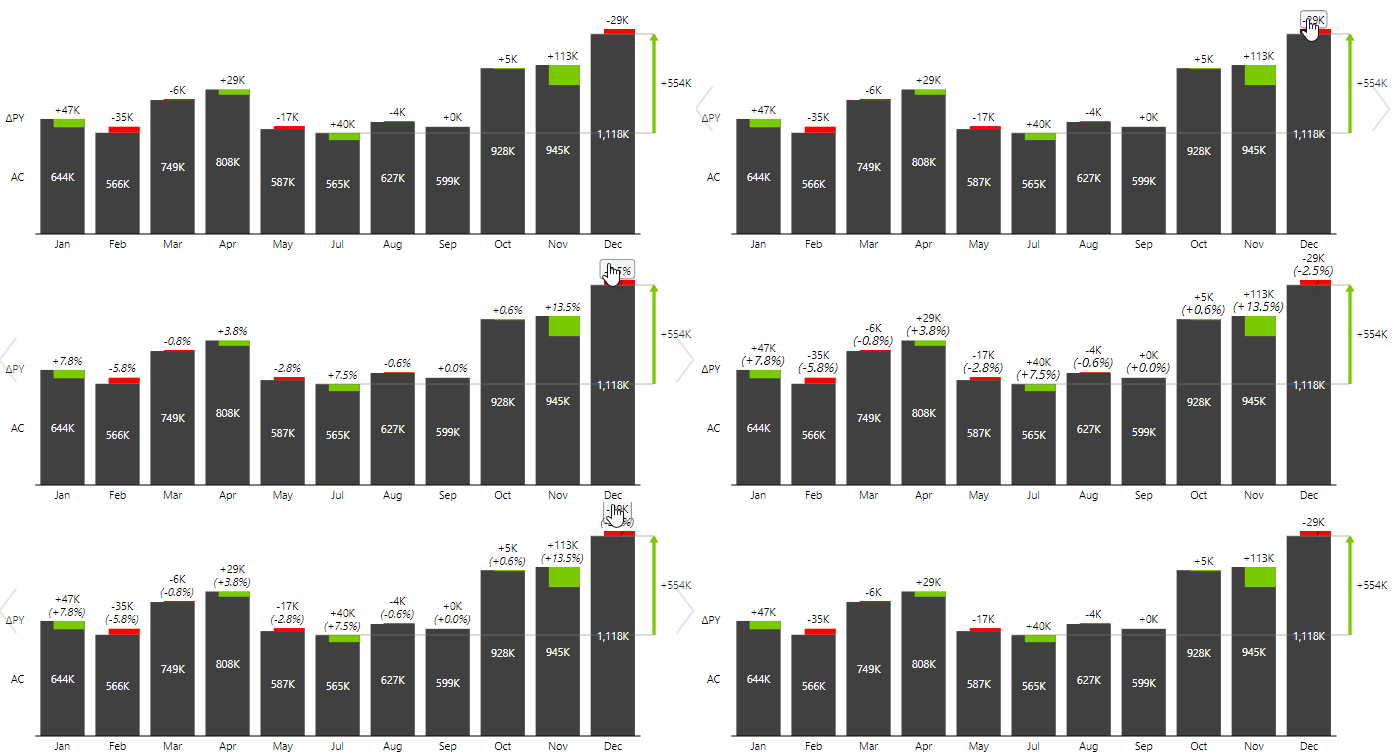
Of course, there’s still the option of switching between absolute and relative variance labels with a click of a mouse.

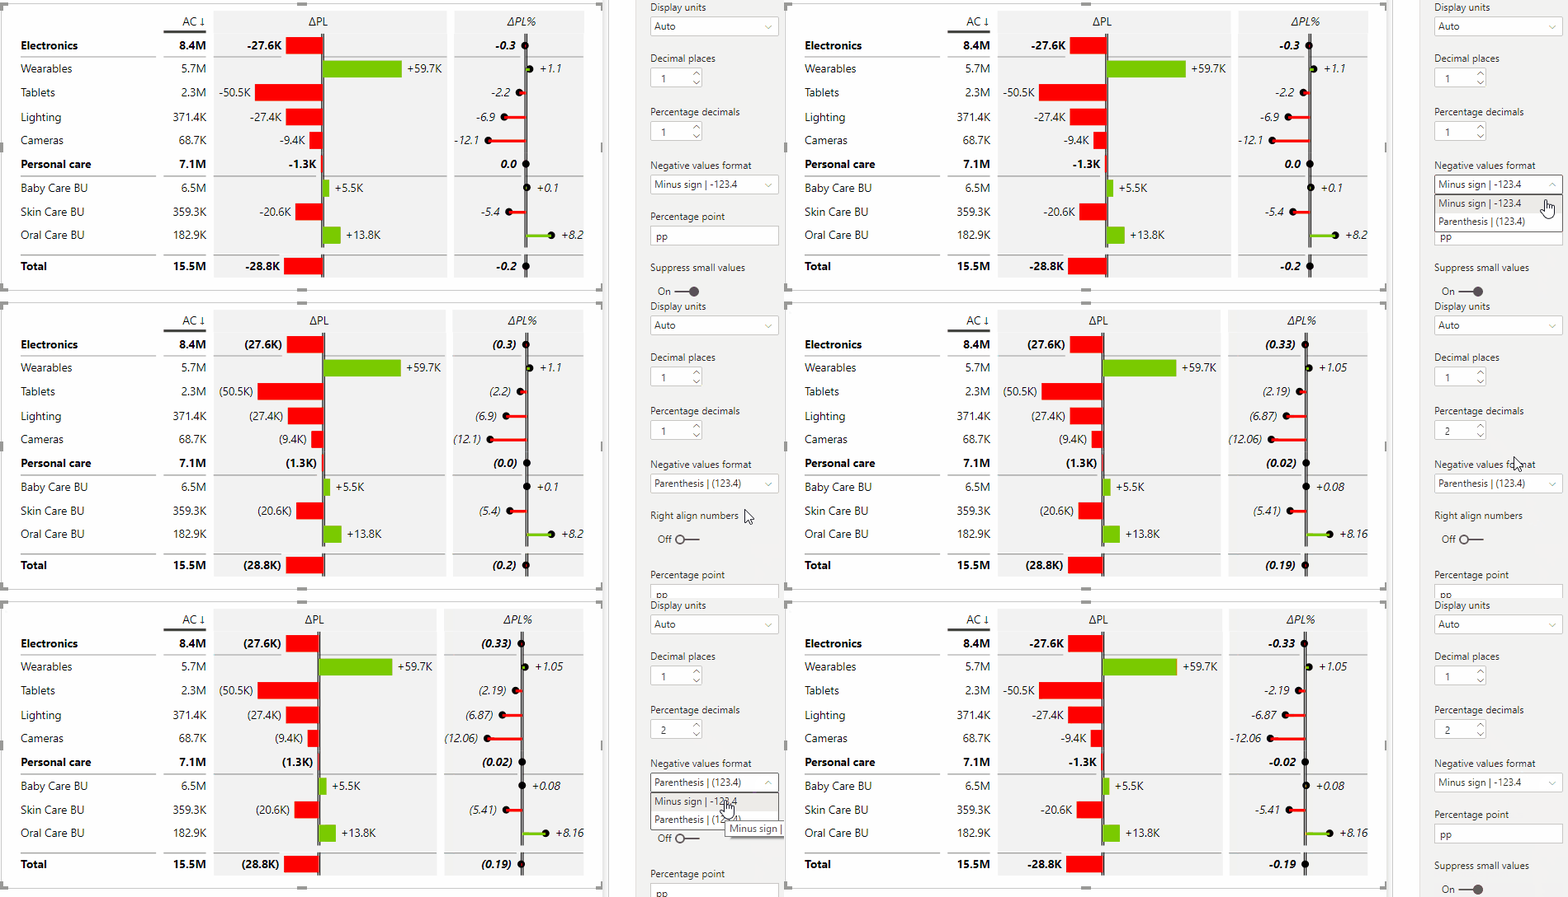
Another useful feature is the negative values format setting. You can select between format with “-“ like for example -27,4K or parenthesis format (27,4K). No workarounds are needed, regardless of your location.

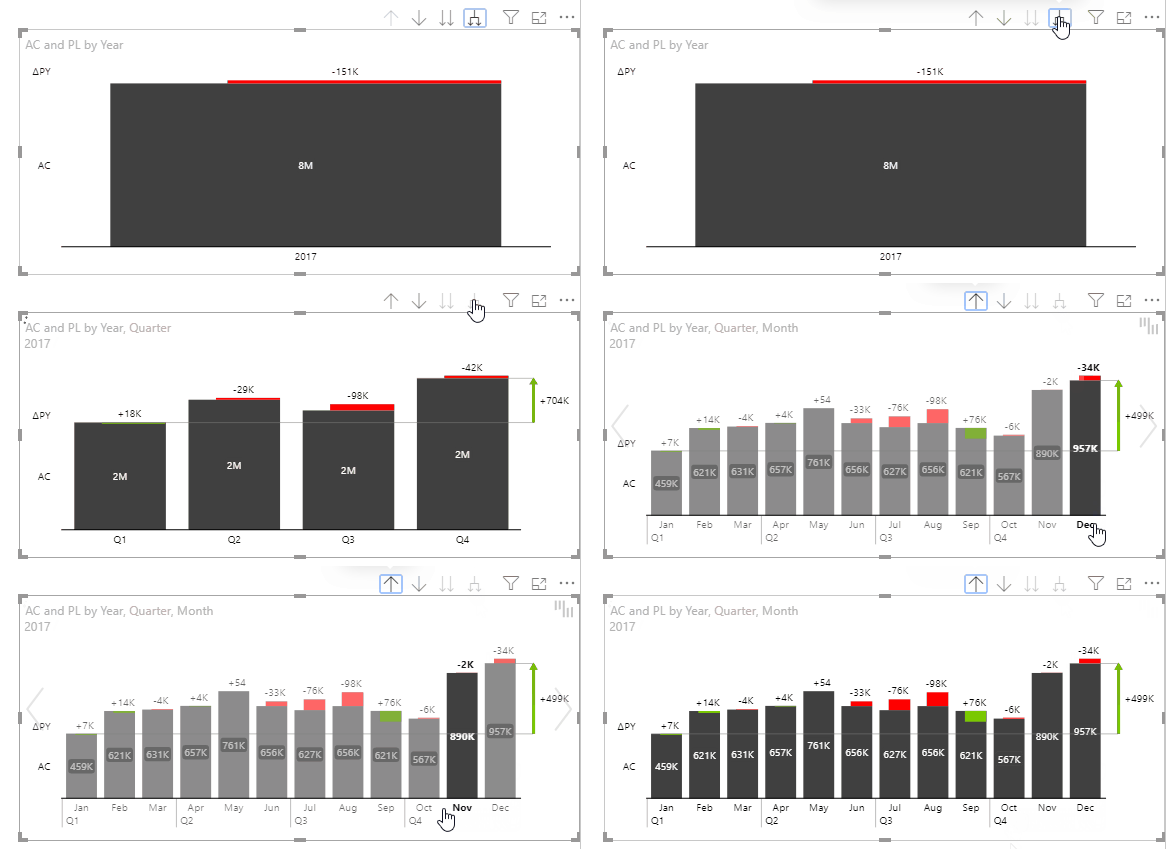
Multiple level hierarchy drill-down can often result in awkward labeling. In these cases, Zebra BI applies smart labeling logic where data labels are organized in a readable way and without unnecessary data duplication.

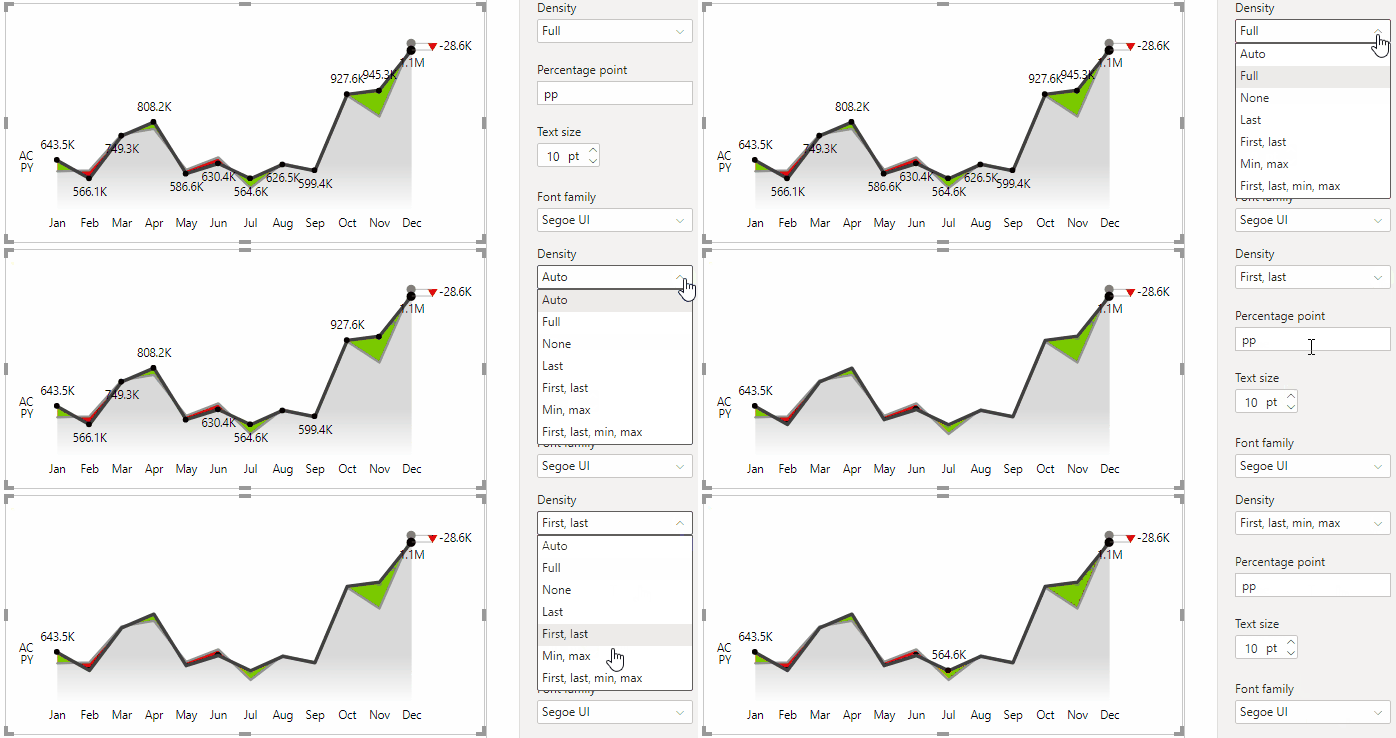
Last but not least, you can also control how many data labels are being displayed. By default, Zebra BI automatically sets data label density based on chart width, number format, deviations, etc. But you can use different options like Full, First, First and last, Min and Max, etc., depending on the message you want to point out.

Of course, data labels font size and font family can also be adjusted. You can also choose not to display data labels but, generally, we would not recommend this.
There are other elements in Zebra BI charts that you can manage, labels being only one of them. Read more about managing elements. →