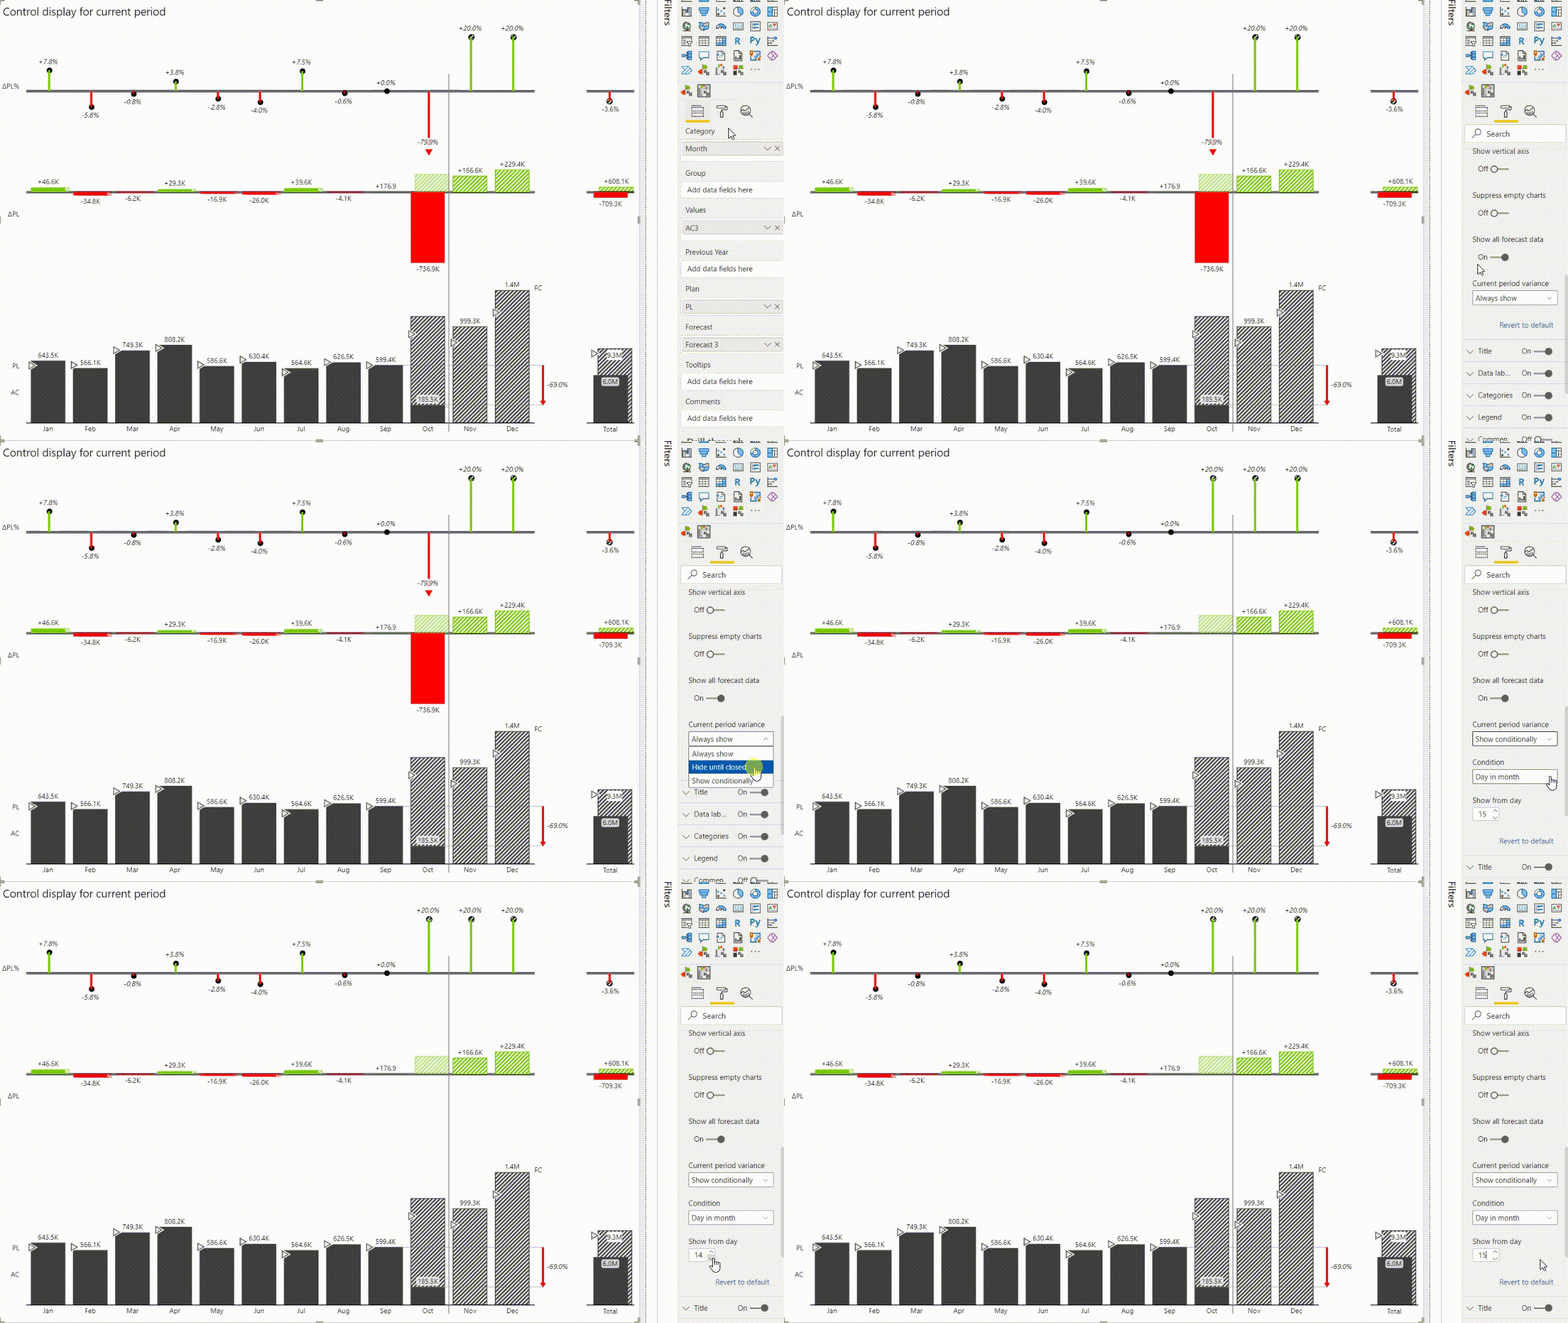
With Zebra BI Charts visual you can decide whether you want to always show the current period variance, hide it until the start of the next month or show it conditionally from a specific day on.
When you have a monthly data series within the current period, your actuals are coming in from day one while you can also have a forecast for this current period (a month in our case). Meaning, you have the data for Month to date (MTD) versus the full month forecast.
At least at the beginning of the month, this can be annoying, because the visual would try to compare the MTD at the beginning of the month, e.g., after two or three days of sales, with the full month forecast. As a result, the variance between MTD and the full month forecast will be very big, which can be distracting from the actual performance. To mitigate this, we have developed a solution that you can implement in 3 easy steps.
How to modify the appearance of the current period variance?
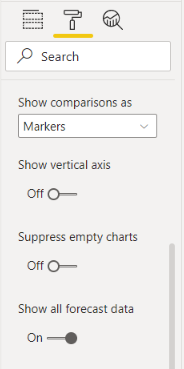
Step 1: Go under Chart settings and check if the Show all forecast data option is set to On. This way you will keep displaying all your forecasts, including the one for the current period.

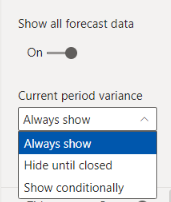
Step 2: Under the setting Current period display you can now select one of three options how you want the variance to be presented.

Step 3a: If you have monthly updates, you can select the Always show variance option.
Step 3b: If you have daily updates or even multiple updates within a day, you might want to choose one of the other two options:
- Hide until closed: the variance will be displayed only once the month ends (e.g., if we’re in October, the variance for this month will be displayed on the first of November)
- Show conditionally: the variance will be displayed when a specific condition will be met. You can choose to show it from a specific day in a month, day in a week, month in a quarter, or month in a year. Zebra BI will automatically look at the calendar and start showing the variance when the condition is met.

This feature was part of the Zebra BI 5.2 update.