Annotation layer
With this new version, you can quickly and easily add comments to your ZBI Tables on the fly. There is no longer a need to manage all the comments in the data model. In one click, you can add comments directly to your visuals, highlighting what’s important and providing meaningful context to tell the story of your data.
To comply with Microsoft certification requirements, all comments are saved within the visuals and are not persisted back to the data model, means no write-back to the data model.
You can drag the icon menu to a different position if it’s obstructing some other settings within the visual. The menu will auto-reposition to the original position once the visual is refreshed.
Table Comments
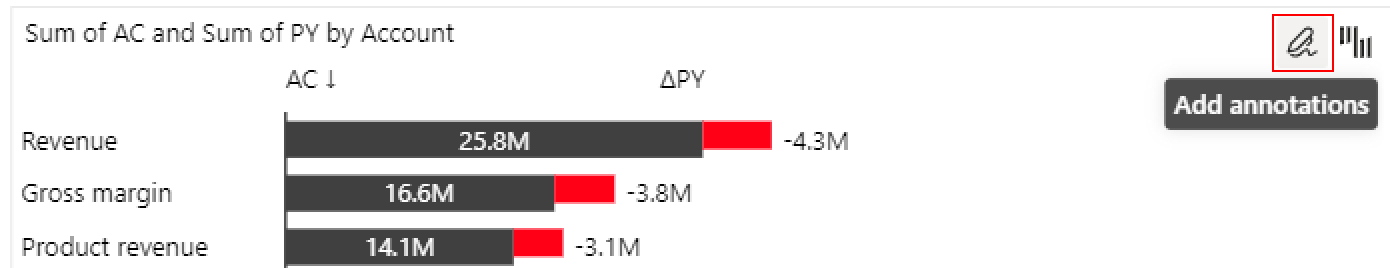
Click the “Add annotations“ icon in the top right corner to access the annotation layer. Then you can find “Add comment“ and “Add highlight“ icons in the annotation pane. To add new comment to a table, click the commenting icon, place it on the visual, type your comment and save it.
You can edit or delete a comment by clicking the icons beside a specific comment.

Additionally, comments can be formatted using rich text formatting options.
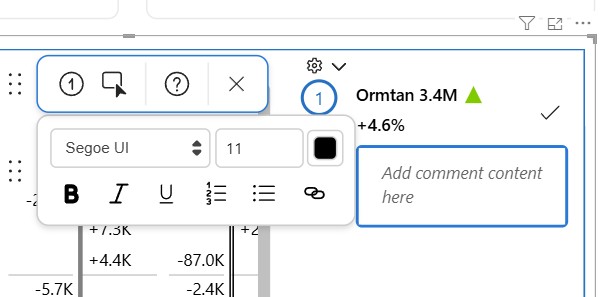
Table Highlights
Highlighting annotations are specifically intended to highlight different parts of the visual and draw the viewer’s attention to convey the message. You can either to highlight single data points (ellipsis highlight) or groups of data points (area highlight) to direct the viewer’s attention.
You can find the “Add highlight“ icon in the annotation pane by clicking the “Add annotations“ icon in the top right corner of the visual.
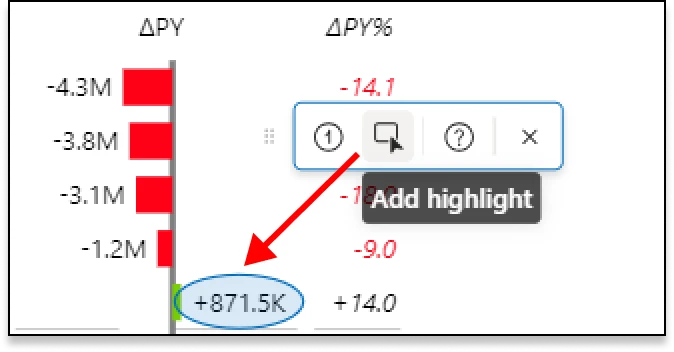
Ellipsis Highlight
Ellipsis highlight is used to highlight a single data point and it is drawn around the data label. Ellipsis highlights can be added by simply clicking on the data point:
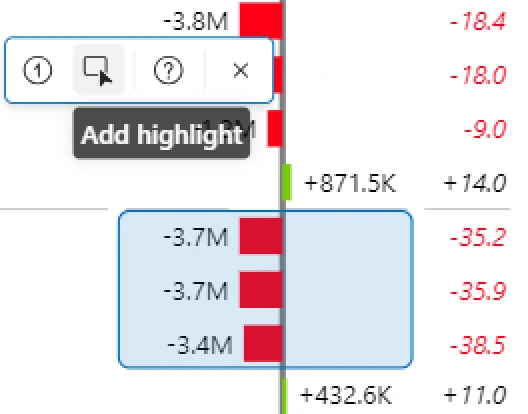
Area Highlight
Area highlight is used to highlight multiple data points. To add the area highlight, click and drag the mouse pointer over the data points you want to select.
Filter context
You can use slicers, filters, and other visual elements to filter the contents of your Tables, and annotations (comments and highlights) will respond to your filtered state correspondingly.
First, you need to provide the Tables visual with the data that filters it. You can do this by adding the fields and measures you want your annotations to respond to in the dedicated “Filters” bucket:
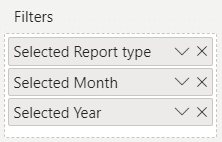
For example, you are using a slicer to select report type and time and you want your comments on the Tables visual to be associated with those values. In this case, you need to make sure that the report type and time (Month, Year) are added to the Filters bucket, and then you can display the right annotations for each slicer selection:
You can read more about setting up filter context in this link.