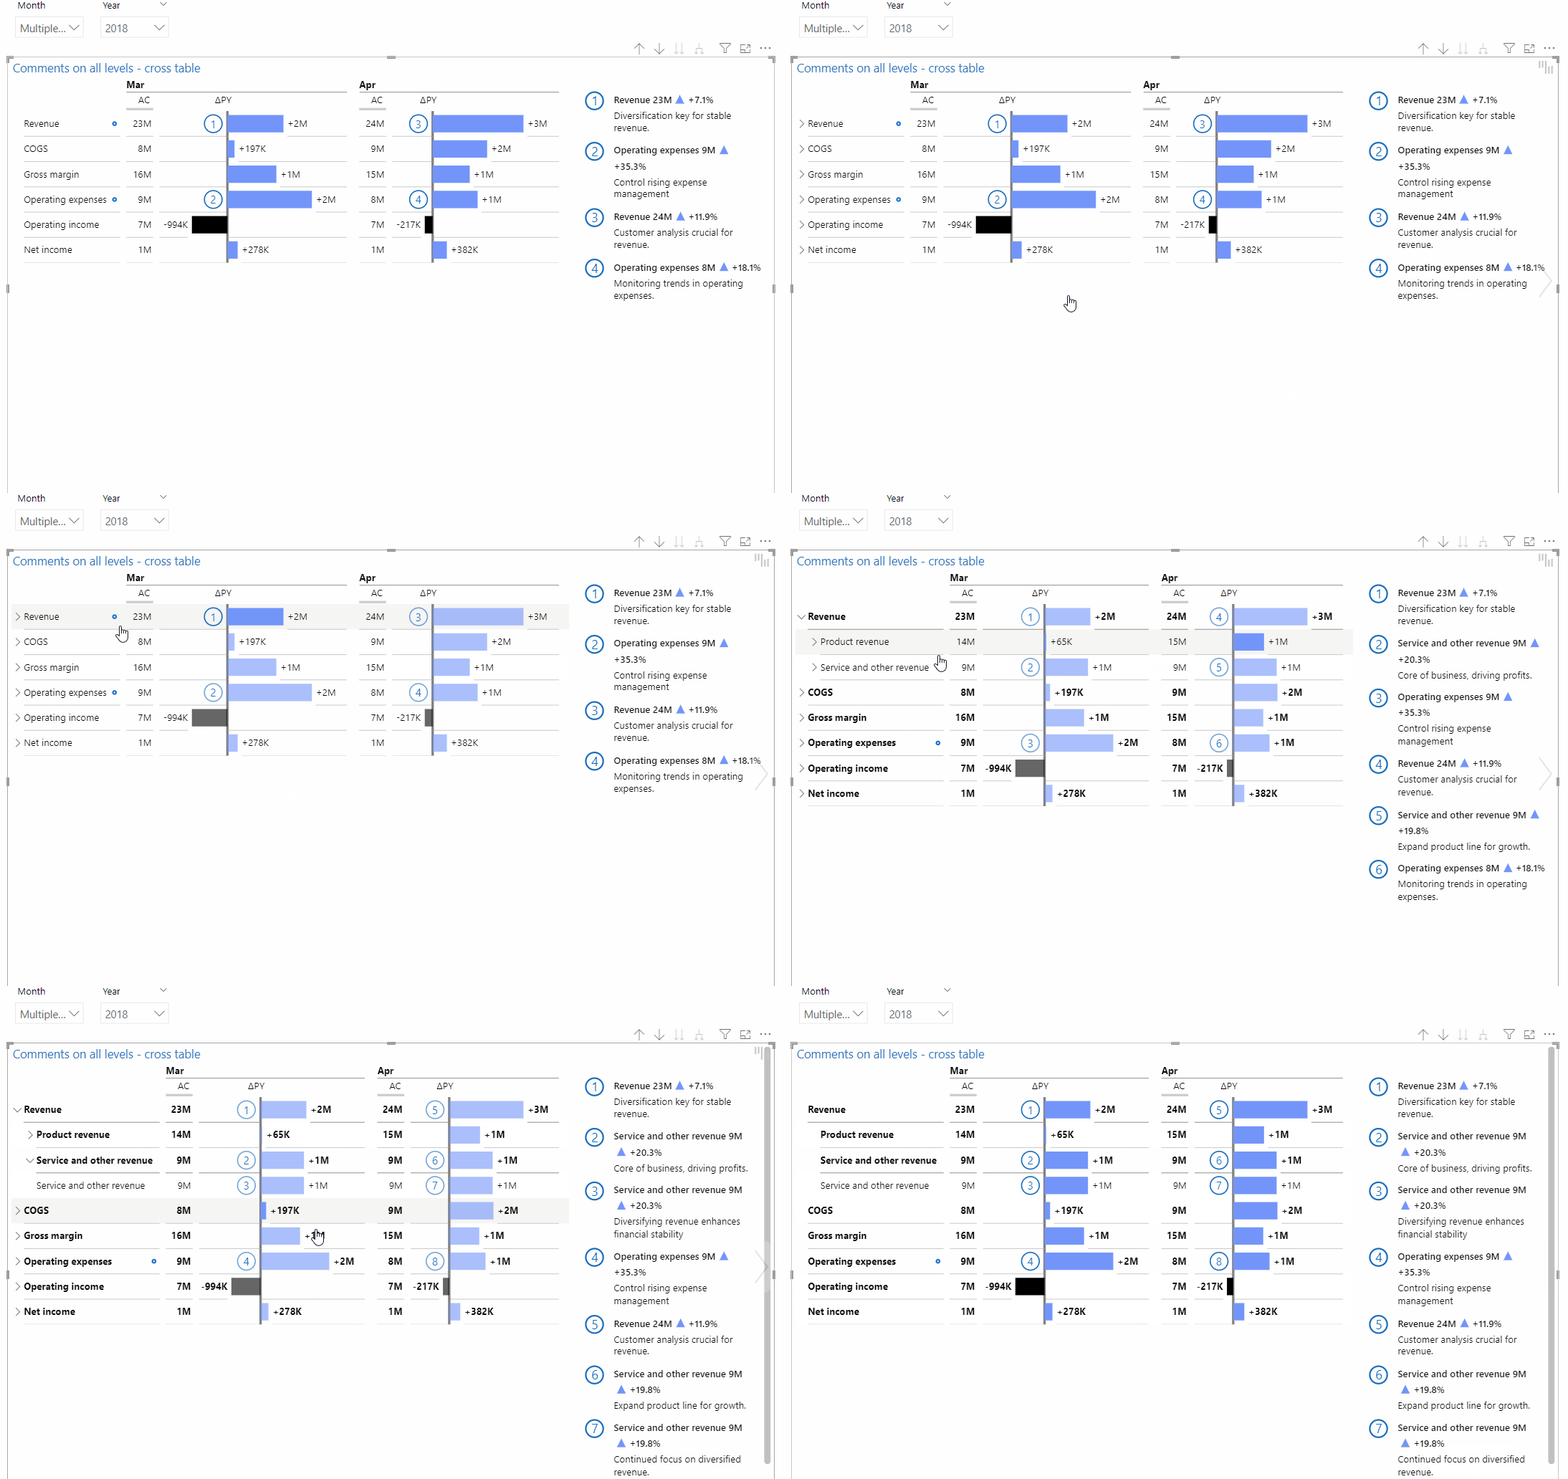
Introducing a notable enhancement in the Zebra BI Tables 6.7 version– the ability to showcase comments at every level of the hierarchy. This new feature offers a more customizable and user-friendly experience.
You will now be able to choose from the following options to display comments:
- On the desired number of levels, practically everywhere
- On the lowest level only
- At the highest level only
- On the middle level only
Furthermore, as an integral aspect of this improvement, we are incorporating comment indicators directly into the visual representation. These indicators serve to alert viewers to the existence of comments at lower levels.
Below, you’ll find a step-by-step guide on how to utilize this feature. For assistance, please download the provided Power BI file located at the end of the article.
How to prepare a table with hierarchical comments
Structure the Comments table to feature separate columns for individual comments corresponding to each category level. Navigate to the Hierarchical comments table for reference to access distinct comment columns for Account group, Account subgroup, and Account.
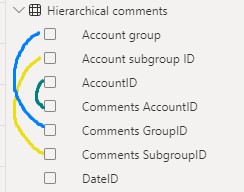
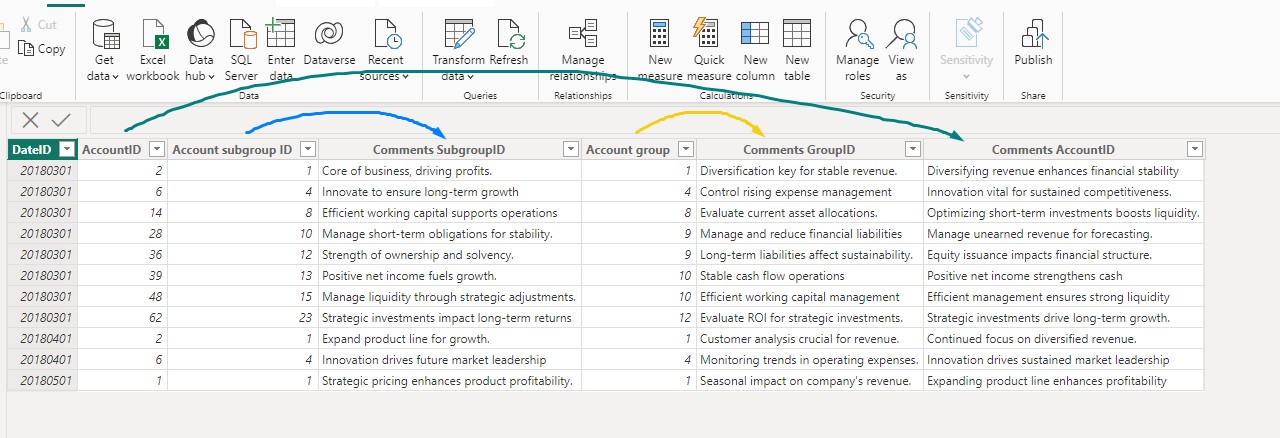
Creating a measure for hierarchical comments
To enable this feature, it’s necessary to create a measure ensuring that comments get correctly displayed on every level.
Generate a measure that determines the relevant column to use for each level. Navigate to the Comments measure all levels for a comprehensive understanding of its construction across all levels. Simply copy and paste the measure below and replace the corresponding fields with the ones in your report. This measure describes the implementation of comments on all levels where three levels are included in the visual. If fewer or more comments are needed adjust the measure to your case.
Comments measure all levels =
VAR low =
    ISINSCOPE ( Accounts[Account] ) -- the part where you determine the lowest level
VAR mid =
    ISINSCOPE ( Accounts[Account subgroup] ) -- the part where you determine the mid level
VAR high =
    ISINSCOPE ( Accounts[Account group] ) -- the part where you determine the highest level
RETURN
    IF (
        low,
        SELECTEDVALUE ( 'Hierarchical comments'[Comments AccountID] ),
        -- build up from bottom to top, starting at the lowest level and the comment column of this level to return
        IF (
            mid,
            SELECTEDVALUE ( 'Hierarchical comments'[Comments SubgroupID] ),
            IF ( high, SELECTEDVALUE ( 'Hierarchical comments'[Comments GroupID] ) )
        )
    )
When the measure is ready you can simply drop it in the “Comments” placeholder. The visual will automatically recognize the calculation and display corresponding comments. Additionally, you can turn on the “Comment box” to display comments on the side of the visual
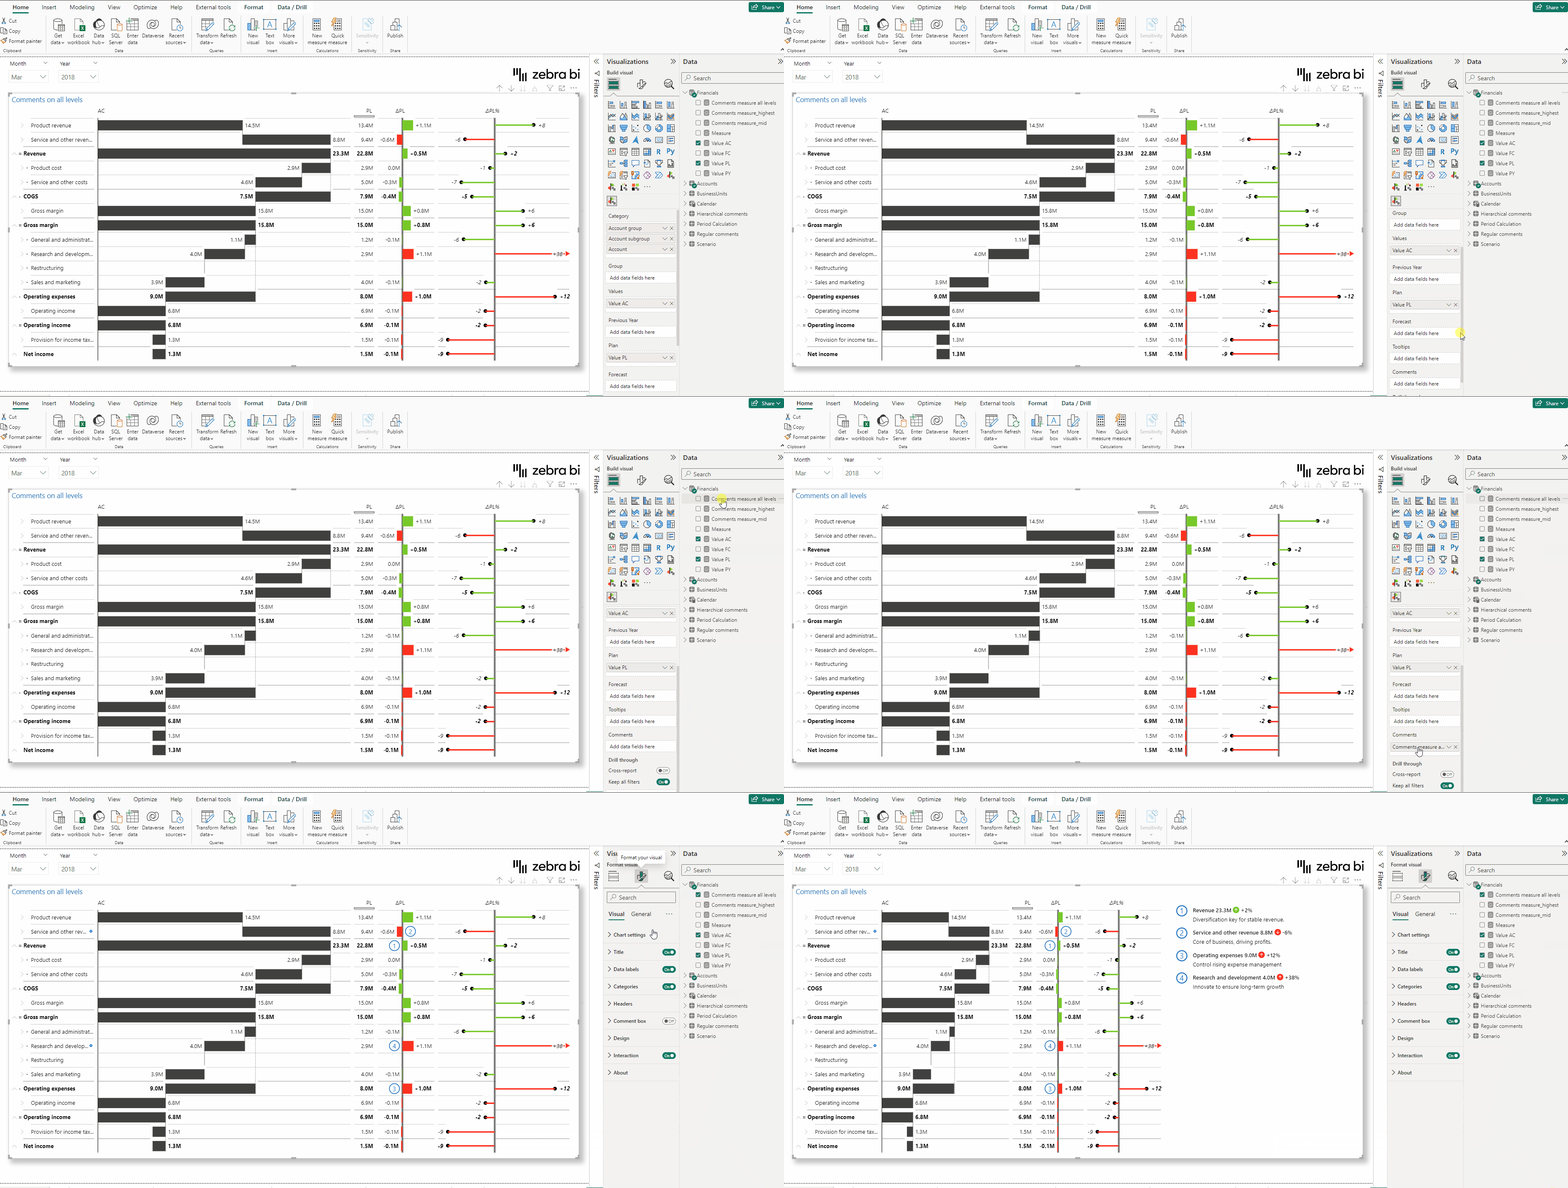
You will find several different situations of how hierarchical comments work and guidelines on appropriately constructing the measures.
Indicators
Comment indicators will appear on any row with comments in the underlying levels. These indicators signal the presence of a comment below.
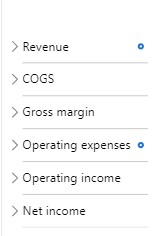
Clicking on indicators will expand the row to reveal the next level, which includes the corresponding comment.
