Learn how to consolidate your data for an actionable KPI dashboard when you have all the data in a single Excel table.
Preparing data article series
- Single card
- Basic Card with a single Excel table
- Power Query (more advanced)
- DAX/Switch (the most flexible)
Learn how to use a single Excel table for creating a KPI card
A tip before we start: always have your KPIs organized as a dimension, as opposed to standalone measures for every single KPI. This is one of the most important rules when creating a KPI dashboard with the Zebra BI Cards visual. If you organize KPIs as measures, you will not get the desired result. When adding the KPI dimension to the Cards report, a dedicated card for every single KPI will be generated within the same visual.
You can use the same PBIX example as Mark did in the video. Download it below.
Now, let’s create a basic card using a single Excel table.
Step 1: Prepare a table in Excel which contains all of your KPIs and values.
Step 2: Copy the table and paste it to Power BI by clicking on Enter Data. Paste the table and click on Load. Check your data in the Data tab.
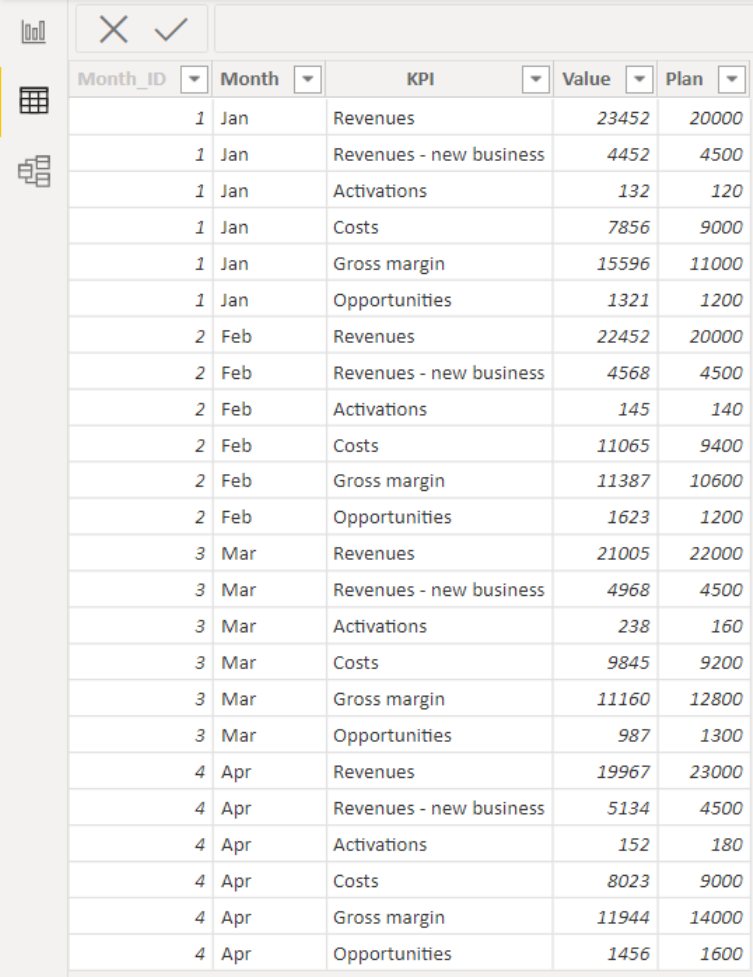
Step 3: Move to Fields and put one of the dimensions (in our case Month) to the Category (trend) placeholder, values in the Values placeholder, comparison measure to the corresponding placeholder (in our case plan measure to the Plan field), and, finally, KPIs to the Group placeholder.
In this case, the KPI column presents a dimension. Using such a simple table is already enough to create an outstanding dashboard using Zebra BI Cards visual.
Once the KPIs are added to the visual, a dedicated card for each KPI will appear in the same visual.
Each individual card can then be formatted, resized, reordered, inverted, and further enhanced using a wide variety of options.
Learn more about Zebra BI Cards formatting options.
Get an overview of Zebra BI Cards visual.
You don’t always have the option of putting all KPIs in a single table. Find out how to prepare data for a slightly more advanced report using the Power Query or consolidate data using DAX with the SWITCH statement.