The Zebra BI visuals can handle Forecast very well but there are a few things that need to be taken care of. The reason for that is that there are default variance calculations in place. As long as there are no Actuals, Forecast is compared to Plan. But as soon as there are Actuals, they will be compared to Plan, and Forecast values won’t be shown anymore.
Let’s take a look at a practical example.
It is July 2020 and you want to compare Actuals to Plan for all the past months. For the months to come you want to compare Forecast to Budget. Basically, this is what you want to see:
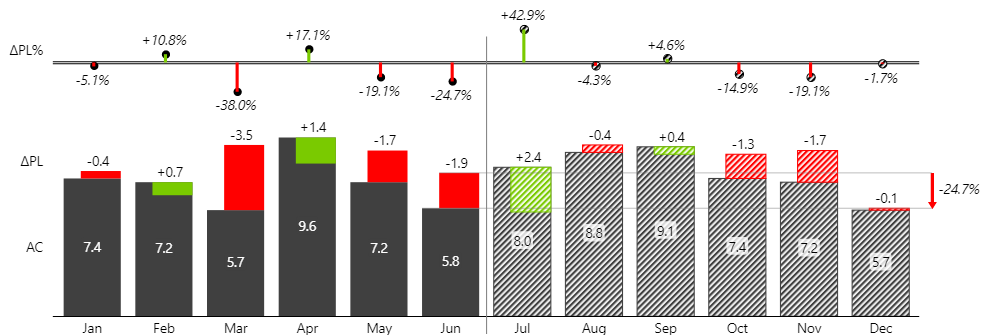
For this to work, it’s important that for future months, Actuals are not included in the visual ( Actuals need to be blank because zero is treated as a value). In many scenarios, data is loaded from an ERP or other source system which already includes postings in future months. This can lead to an image like this:
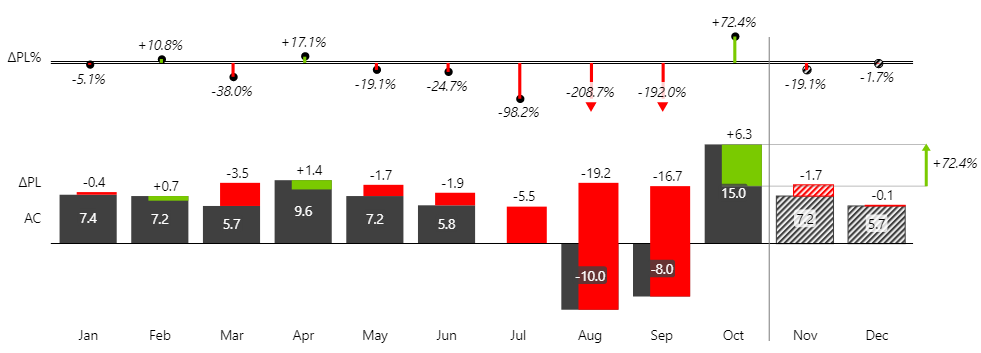
You can see that the period Jan – Jun is the same as in the first picture but the second half of the year shows massive deviations due to the fact that Actuals for July to October have already been loaded into the report even though these months haven’t been properly closed yet and therefore don’t show final figures.
Luckily, there are different ways of how this can be solved:
Option 1 (not recommended): Exclude a load of Actuals for future months
- PRO: No extra work to be done in Power BI
- CON: Nobody can see future months in the report but in many cases, it makes sense that some individuals also see periods that are not released.
Option 2 (recommended): Maintain a separate table that indicates which months have been released and only allows specific people to see these values.
- PRO: Have all data available in the report and have full flexibility.
- CON: More initial work when setting up the report
Option 3 (not recommended): Automatically release a month on a specific day of the following month
- PRO: Flexibility from Option 2.
- CON: Manual work is needed in case the automatic rule needs to be overruled.
Since we recommend option 2, it will be the focus of this article.
First, you need to create and add a table with information about which months are released.
In case this information is available in your source system, it would be best to load it from there. If this is not the case, a simple solution is to load this information from an Excel file. Such a table could look like this:
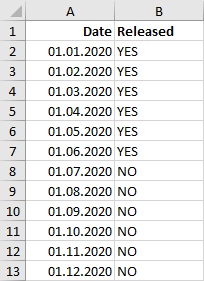
Whenever an additional month is ready to be published, the word “YES” can be added to the table and refreshed in Power BI. See this article to learn how to import date from Excel to Power BI.
Because only Actuals of future months needs to be hidden, you need to add the column released to the facts table.
This column will contain YES for all values which are final and can be seen by everybody. These are the Actuals from already closed months and Plan and Forecast values for all months, including future months.
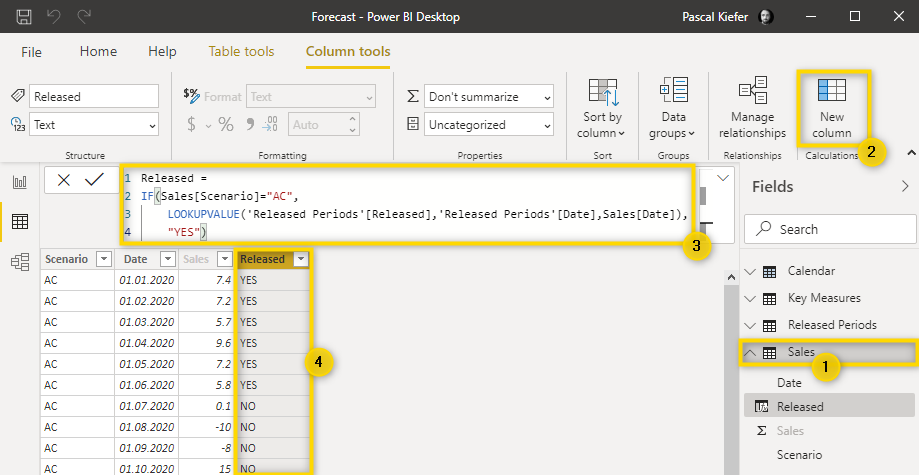
Follow these steps to add the additional column:
- Select the fact table to which you want to add the additional column with the released indicator
- Click New Column
- In this sample, we used the following DAX formula to create the column:
Released =
	 IF(Sales[Scenario]="AC",
	 	LOOKUPVALUE('Released Periods'[Released],'Released Periods'[Date],Sales[Date]),
		"YES")
Let’s break this formula down into its parts:
Released =
This is the name of the column.
IF(Sales[Scenario]="AC",
The rule is only applied to rows that have “AC” in the column Scenario. This means that for the scenarios Plan (PL) and Forecast (FC) everybody can see all months.
LOOKUPVALUE('Released Periods'[Released],'Released Periods'[Date],Sales[Date]),
The LOOKUPVALUE works similarly to a VLOOKUP in Excel. Basically, you have to indicate the column in which the desired result is located (In this case it is in the table Released Periods and in the column Released. Next, you need to define in which column you want to search (In this case it is column Date in the Released Periods table). Now you need to indicate what you are looking for (In this case it’s the value in the Date column of the Sales table.
"YES")
This expression is part of the IF statement from above. It means that if the Scenario is not AC, then the new column should have the word YES.
Create Access right (RLS – row-level security)
Since some people should only see the Actuals of months that have been released, you need to add the respective row-level security authorization role.
To do this, select Manage roles:

In the next window, you’ll need to create a new role.
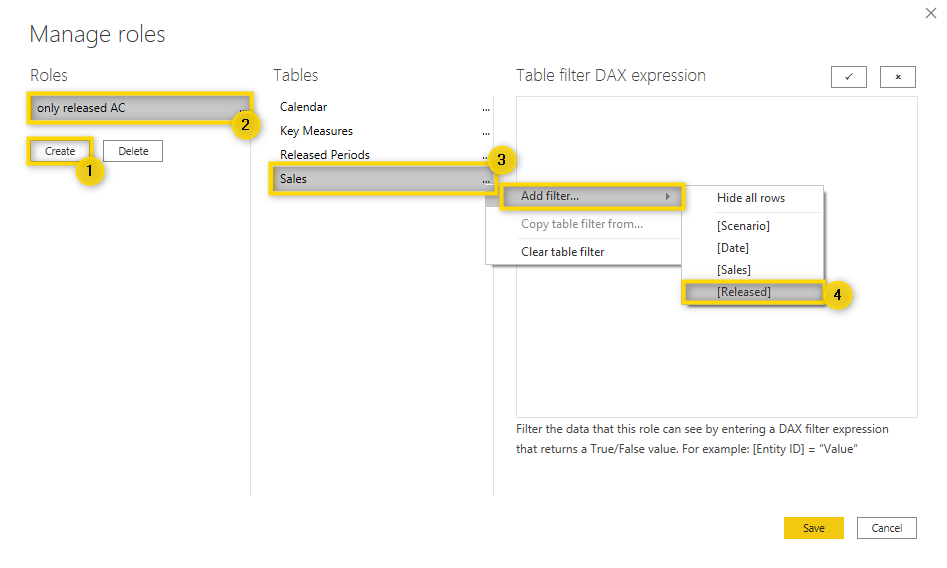
1. Click Create.
2. Give a proper name to the new authorization role (The name should include the definition of the role or what kind of people should have the role assigned).
3. Select the table for which you want to add the restriction.
4. Click on the 3 dots > Add filters and select the newly created column.
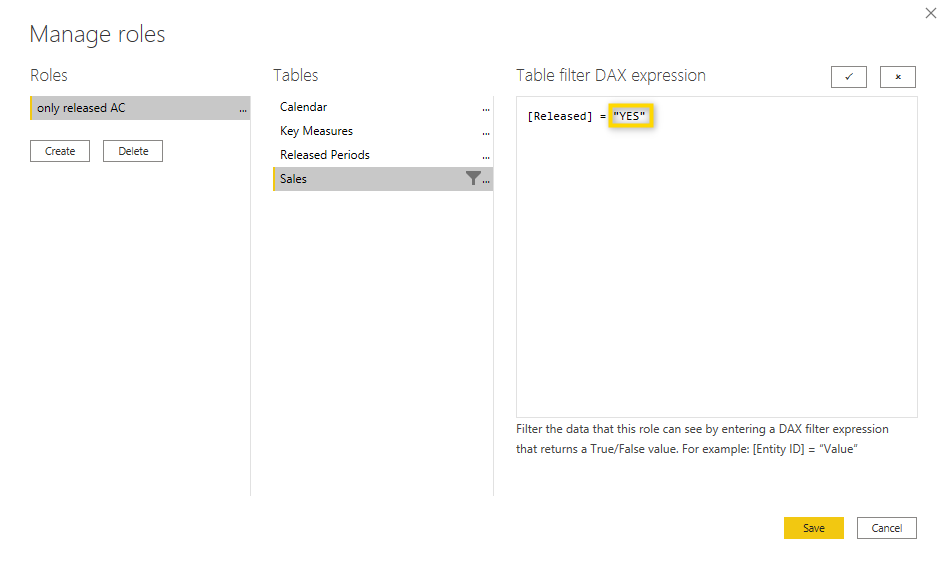
In the previously created column Released, all rows which are visible to everybody are marked with the word YES, so this is what you want to assign to this role. This means that people that don’t have this new role assigned can also see rows that don’t have YES in the column Released.
Now save the new role and in the next step, you can test it.
Test Access right (RLS – row-level security)
Without any role applied, you can see all data and the report looks like this:
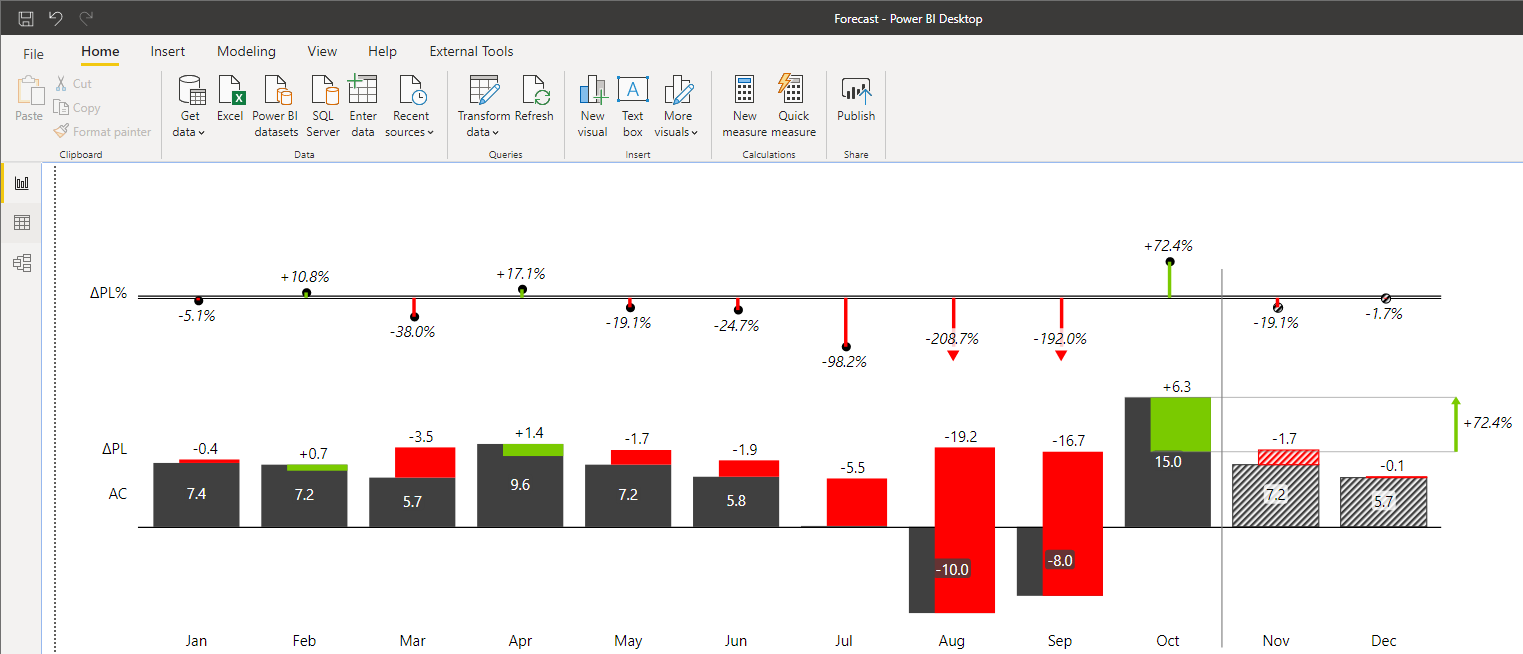
To test what the report looks like with a specific person or role, select View as and then the specific role.
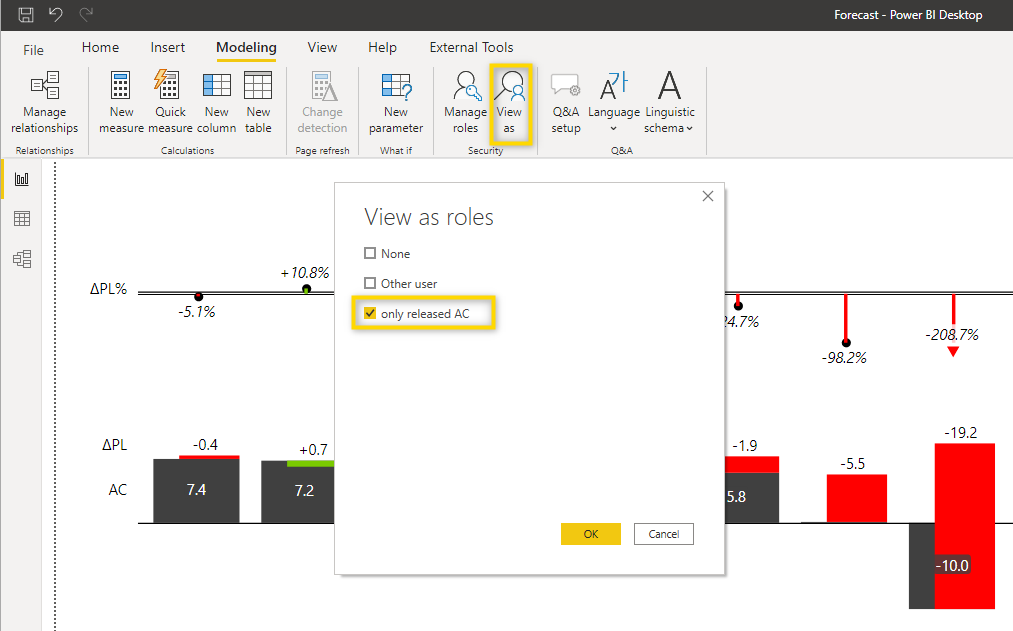
Since you want to see how the report behaves when a user with the newly created role only released AC opens it, let’s select that role and confirm with OK.
When viewing a report with a specific authorization role, a yellow bar appears on top and shows which role has been selected. To go back to the normal view (without any row-level security applied), click on Stop viewing.
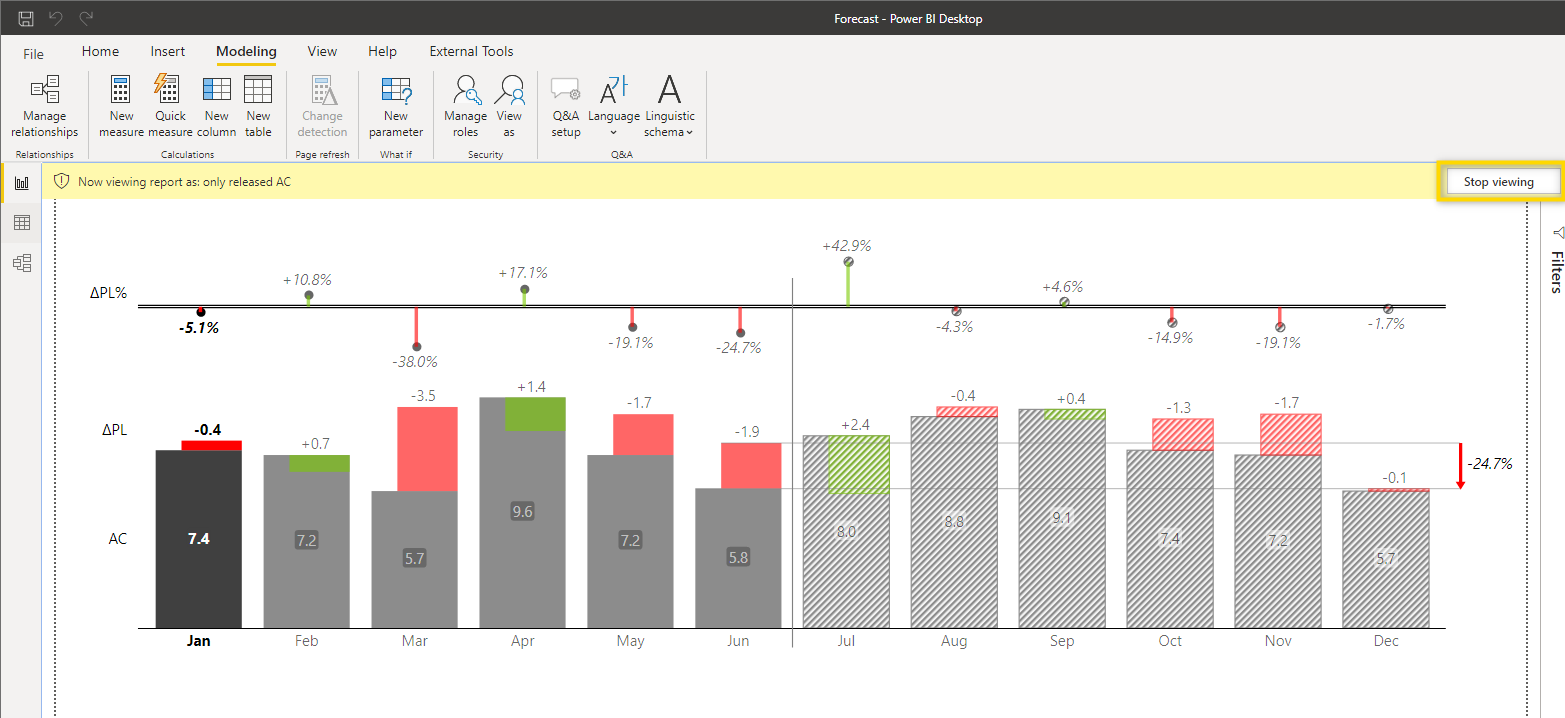
When you compare this view with the initial view from above, you can clearly see that no AC data is shown for the months July – December and you have exactly the picture which you expected.
You now have a report which actually loads all Actuals data, but only displays the months which have been released to the end-user. The finance people or other people you select, on the other hand, can already see the non-final figures. So now you have the full flexibility and everybody sees exactly what is needed.