Power BI, there are many so-called time-intelligence functions that let you make simple or complex calculations related to time. As the time dimension is present in practically every report, these types of functions are some of the most important in DAX. In order for these functions to be able to do their job, a calendar or date table is needed in the data model.
In case you are not a Zebra BI user yet, we suggest you to start your free trial before we dig in.
General information
You might ask yourself why you need this additional table because your fact table already contains a column with the date.
The answer is simple: Fact tables usually don’t contain a row for every date (for example because there’s no data on weekends and holidays). One of the main characteristics of a calendar table is that it contains a row for every day within a certain range.
There are different ways to create a calendar table and, in this article, we will cover 2 of them. But before we get to it, we’d like to share some things which are important independent of how you create the calendar table:
- Only create columns that are really needed.
- Limit the time range to what makes sense for your report (i.e. If not needed, don’t add dates too far into the past or the future).
- Once you have a calendar table you like, save the M or DAX code somewhere, so you can reuse it for the next report.
Create a calendar table in Power Query Editor
1. In Power BI Desktop, add a new blank data source.
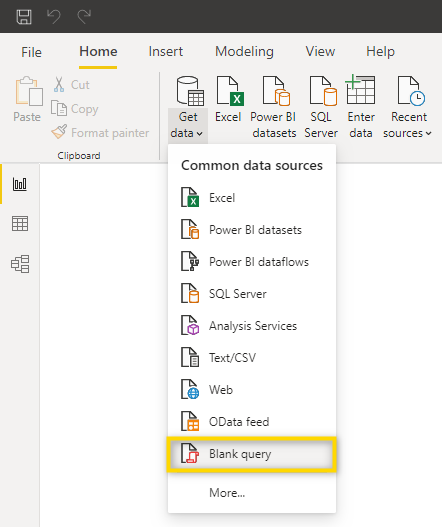
2. Right-Click the Query and give it a proper name (for example “Calendar”).
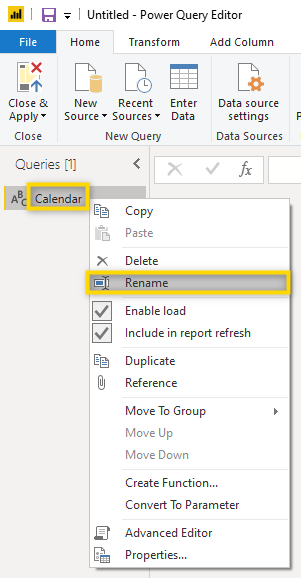
Tip: By pressing WIN + (.) you can also add the calendar Emoji to the description to make it stick out even more.

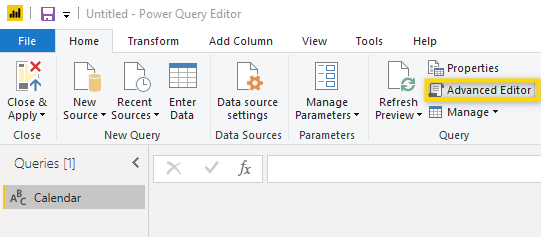
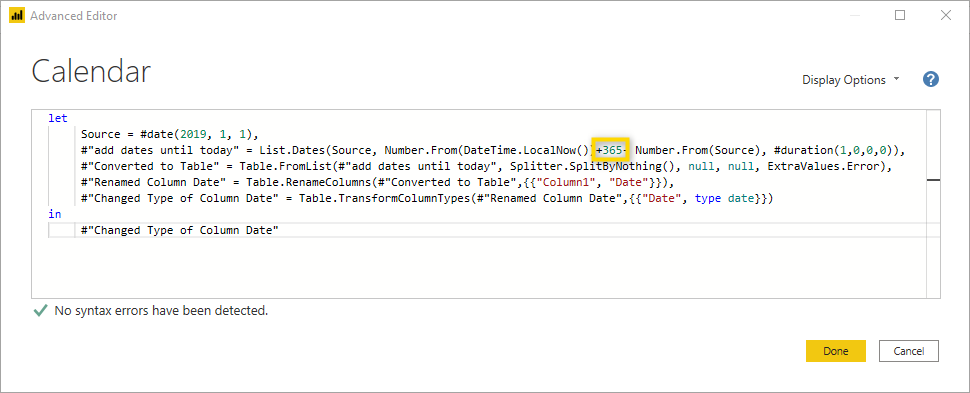
3. Open the Advanced Editor.
4. Paste the following M Code and confirm with “Done.”

let
	 Source = #date(2019, 1, 1),
	 #"add dates until today" = List.Dates(Source, Number.From(DateTime.LocalNow())+0- Number.From(Source), #duration(1,0,0,0)),
	 #"Converted to Table" = Table.FromList(#"add dates until today", Splitter.SplitByNothing(), null, null, ExtraValues.Error),
	 #"Renamed Column Date" = Table.RenameColumns(#"Converted to Table",{{"Column1", "Date"}}),
	 #"Changed Type of Column Date" = Table.TransformColumnTypes(#"Renamed Column Date",{{"Date", type date}})
in
	 #"Changed Type of Column Date"
5. Customize the date table. You now have a date table that shows all dates between the 1 st of January 2019 and the current date. In case you need a date table that starts with a different date, you can go back to the Advanced editor, and replace the date in the M code.
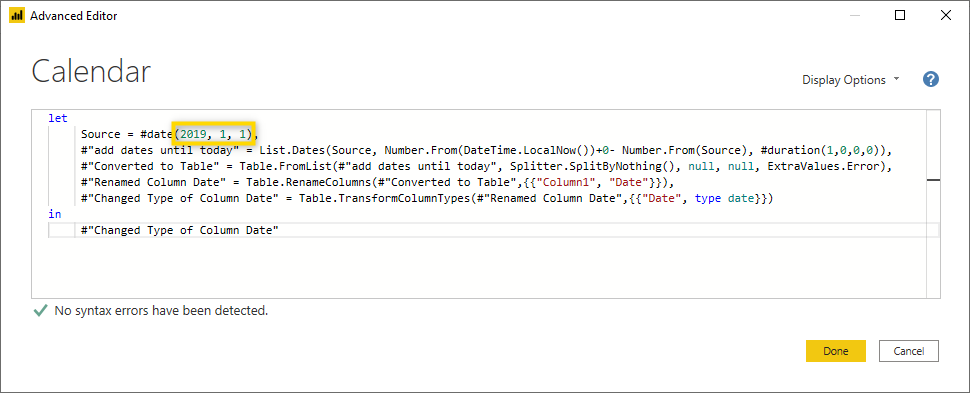
In case you would like the calendar table to also go into the future and not only until the current date, the highlighted number below can be changed. By changing to +365, the calendar table will end at the current date in one year.
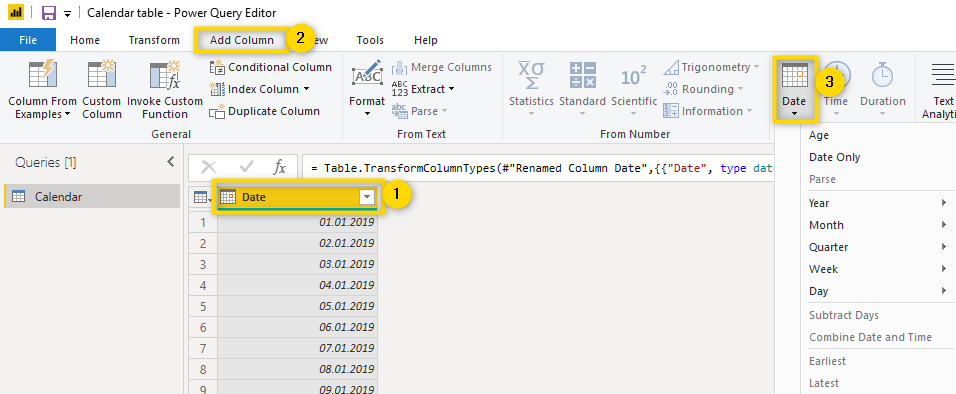
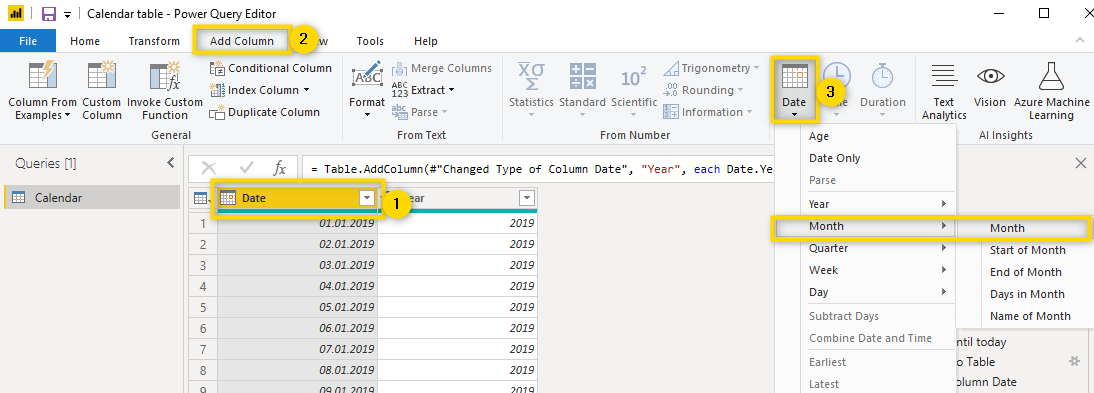
6. Add another date column. You now have a proper date table that works perfectly fine for all time-intelligence functions. But depending on your report requirements, you might want to add some additional columns. So, let’s do that. Since every date is linked to a specific day, week, month, quarter, year, etc. all these elements can very easily be added by selecting the date column and then selecting the Date function from the Add column menu.
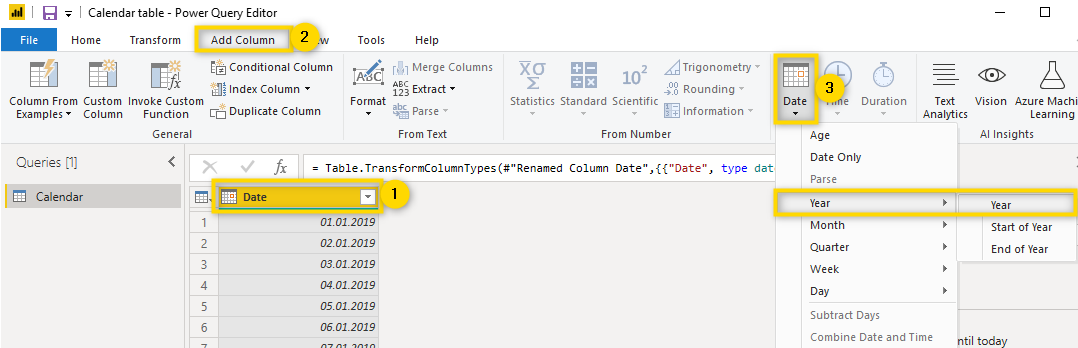
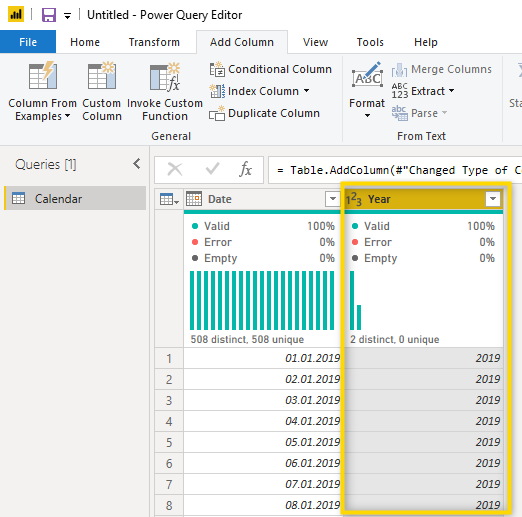
7. Let’s add a column with the year.
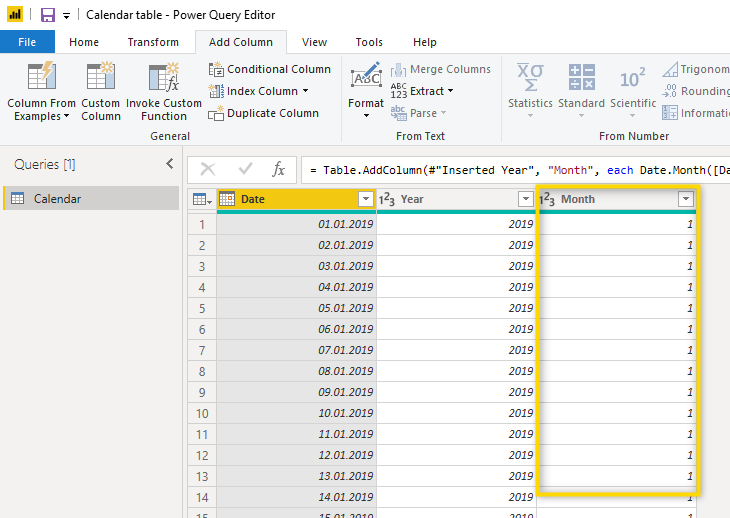
8. Now let’s add a column for the month.
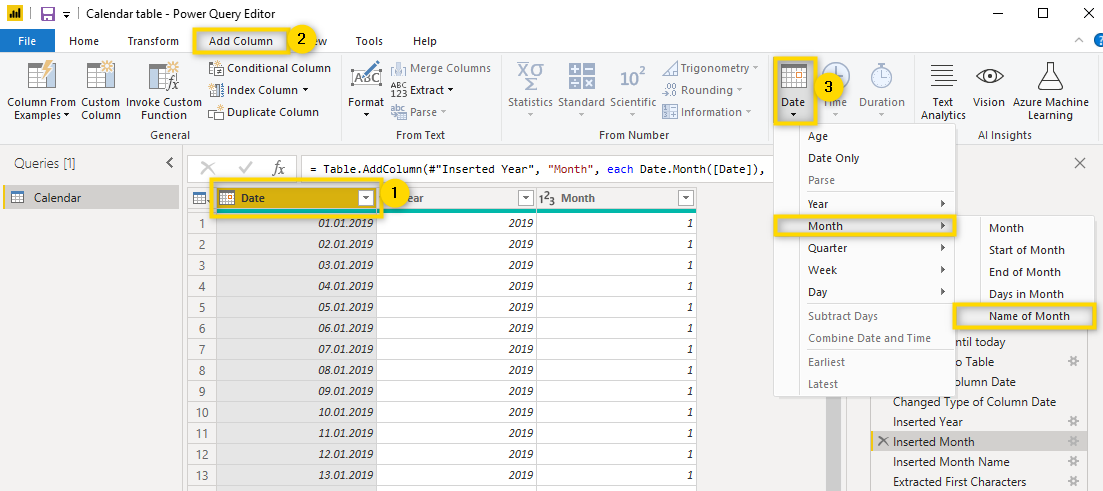
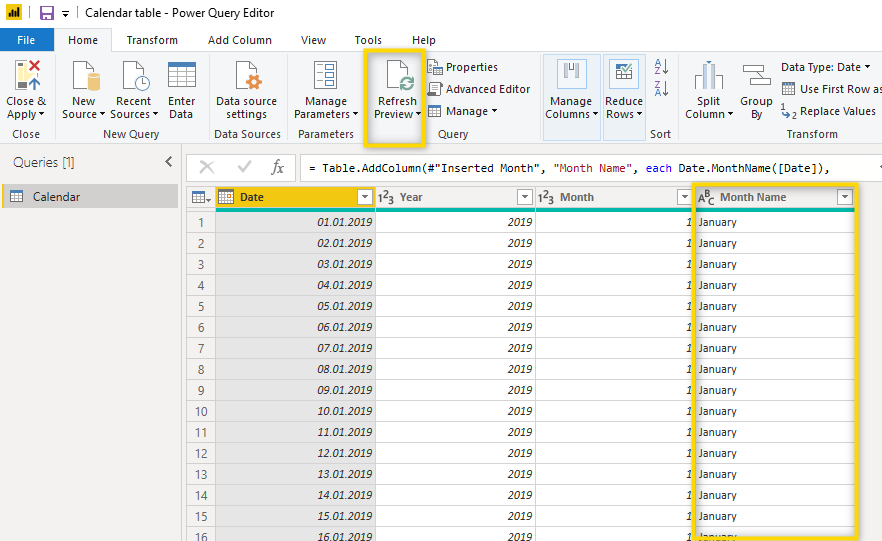
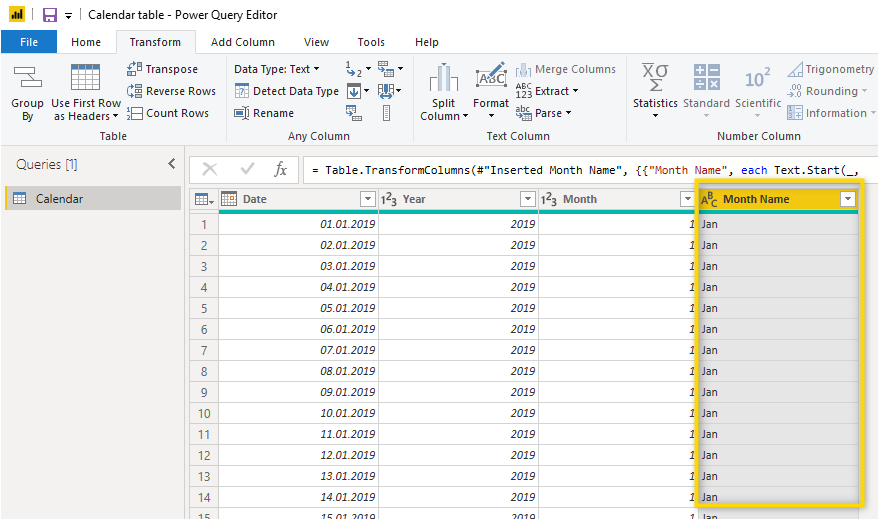
9. What if you would like to have the name of the month? Let’s add that as well.
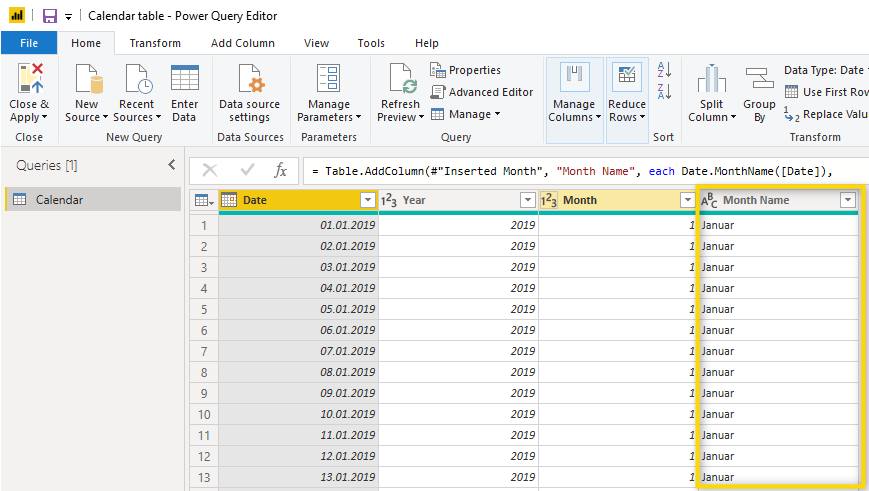
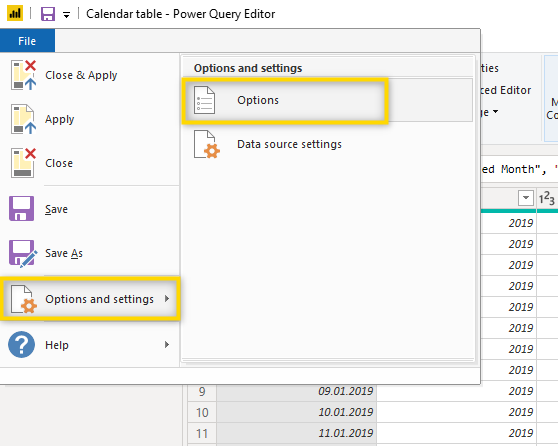
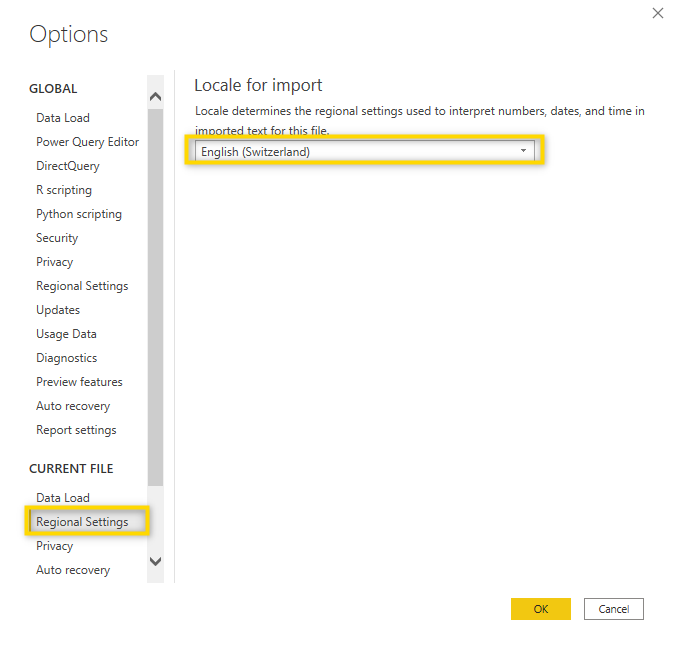
The language of text elements depends on the regional settings. Let’s change the setting to English.
After you have changed the settings, you need to click Refresh Preview to apply the changes.
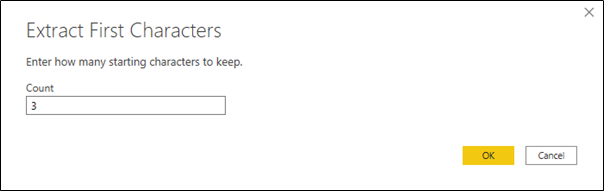
10. Change month name. Most of the time, the full name of the month is too long to show in visualizations so let’s change it to only show the first three letters. Since you want to change the previously added Month Name column and not add a new column, you need to make this transformation in the Transform menu.
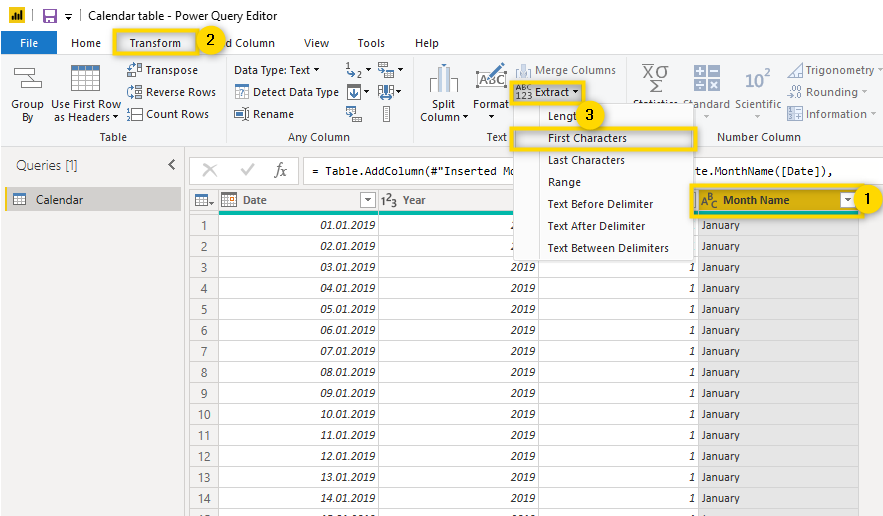
Let’s limit it to three characters.
There are many more columns you could add to this table but since it is best to have narrow tables for performance reasons, it’s best to start with only a small number of columns and only add additional columns if they are really needed. Once you are done with the calendar table and would like to reuse it for your next report, go back to the advanced editor, copy the M code and save it in a text file for later use.
To learn more about Power Query, make sure to look at our best practice tips for Power Query.
Create a calendar table in Power BI Desktop
There’s a DAX function called CALENDARAUTO in Power BI Desktop which automatically creates a calendar table. The range of dates is automatically determined based on the data in your model.
The date range is calculated as follows:
- The earliest date in the model which is not in a calculated column or calculated table is taken as the MinDate.
- The latest date in the model which is not in a calculated column or calculated table is taken as the MaxDate.
- The date range returned is dated between the beginning of the fiscal year associated with MinDate and the end of the fiscal year associated with MaxDate.
Example:
If the dates in the data model are between July 1, 2018, and June 30, 2019.
CALENDARAUTO() will return all dates between January 1, 2018, and December 31, 2019.
CALENDARAUTO(3) will return all dates between March 1, 2018, and February 29, 2020.
Formula
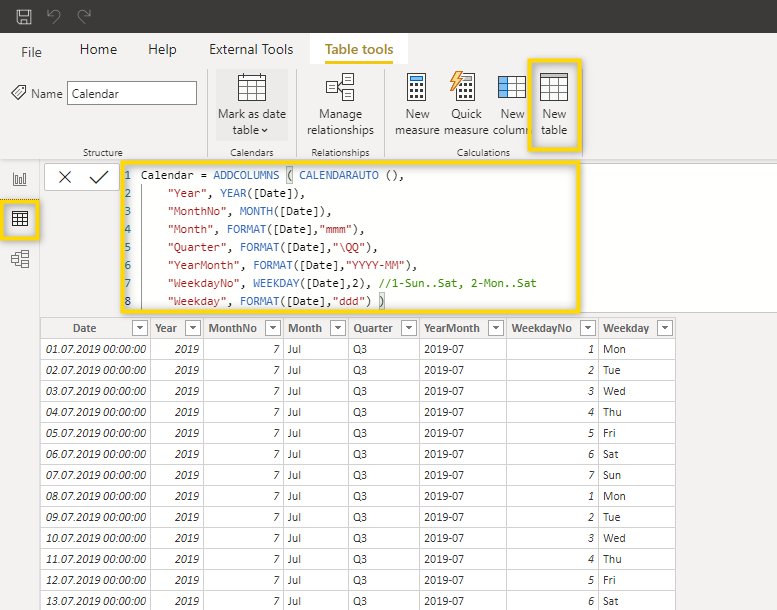
If you have ever downloaded a sample report from Zebra BI, chances are that the calendar table in the sample report was created with this code:
Calendar = ADDCOLUMNS ( CALENDARAUTO (),
    "Year", YEAR([Date]),
    "MonthNo", MONTH([Date]),
    "Month", FORMAT([Date],"mmm"),
    "Quarter", FORMAT([Date],"QQ"),
    "YearMonth", FORMAT([Date],"YYYY-MM"),
    "WeekdayNo", WEEKDAY([Date],2), //1-Sun..Sat, 2-Mon..Sat
    "Weekday", FORMAT([Date],"ddd") )
This is how you add a calendar using DAX in Power BI Desktop:
In the data view, click New table, copy and paste the DAX formula from above and confirm with Enter.
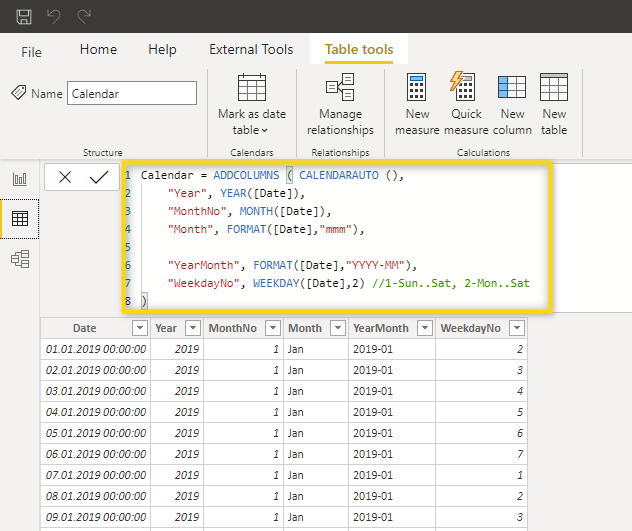
You now have a date table that contains some of the most common columns. In order to have a small data model, you should remove the columns which you don’t need by simply deleting the respective lines from the DAX formula. Let’s assume we don’t need the columns Quarter and Weekday. The formula would look like this:
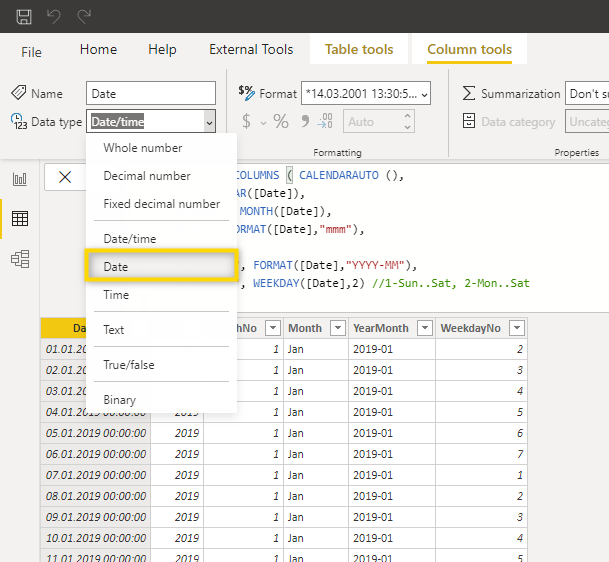
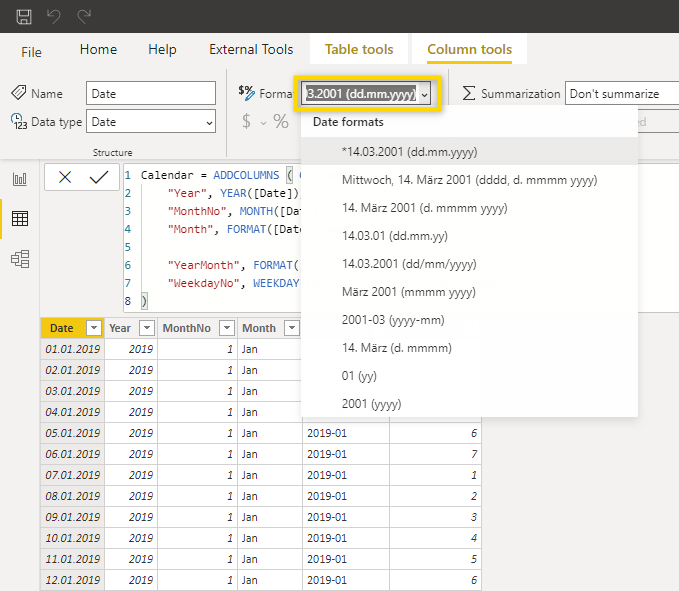
Since the data column shows date and time, you need to change the format to Date and then select the format you’d like to see.
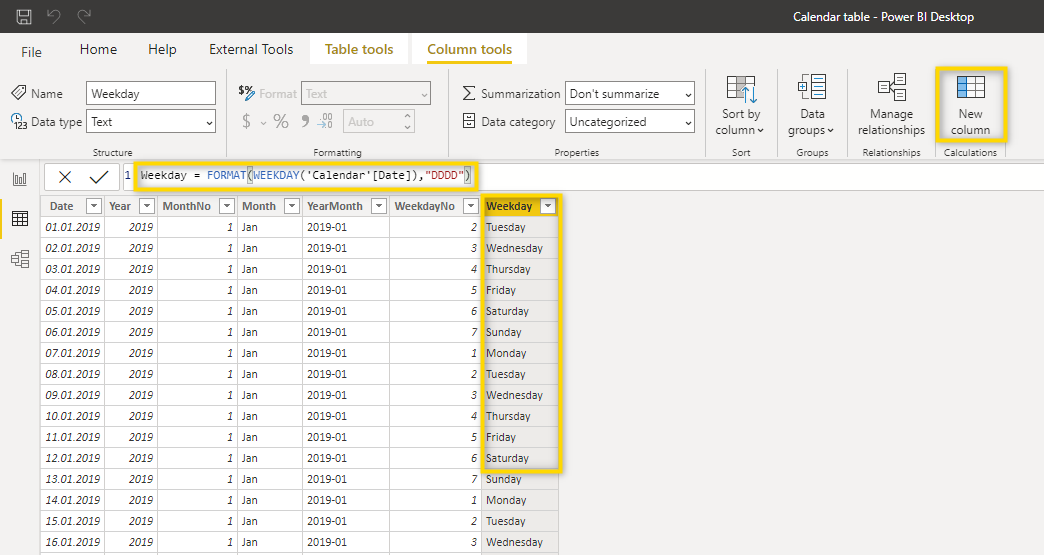
Of course, you can also add additional columns. To do that, you can copy and paste an already existing line in the formula and modify it according to your requirements. Or you can use the New column option which adds a calculated column. For both of these options, you need to know the DAX code for the new column.
You now know how to add one of the most important lookup or dimension tables to your report. Because time is such an important dimension in reporting, you will use this skill in almost all of your reports and will soon be very familiar with it.
Would you like to learn more about Power BI table visuals?