Creating clear and flexible reports often means adapting to different contexts—whether that’s switching between versions, scenarios, or languages. With dynamic column headers in Zebra BI Tables, your headers automatically adjust to reflect filter selections, ensuring that column names always match the context of the data being viewed. This makes reports easier to read, more consistent, and far less dependent on manual adjustments.

How to add contextual filter fields to the visual
When a visual is selected, go to the Visualizations pane and scroll down to the last placeholder called Filters.
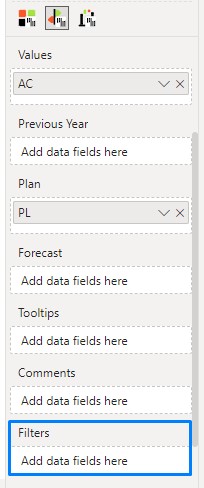
This placeholder can be populated with measures and dimensional attributes to read the Filters applied to the visual. We can create measures on our own to correspondingly display the desired outcome or insert any field we’d like to return the text in the header when it’s been filtered on the page. The second option will create an implicit measure that works only when a single value is filtered within the slicer or filter. Therefore, it’s better to create an explicit measure where everything can be defined correctly.
How to set up a measure
Below is a simple measure that can be used in this example. If you’re trying to filter a numeric or string field, you can use a SELECTEDVALUE function in DAX.
SelectedYear_ = SELECTEDVALUE('Calendar'[Year])Referencing a measure in the column header
To establish a dynamic header, follow these steps after creating all necessary measures and adding them to the Filters placeholder:
- Click on the column header dropdown to activate the editing functionality.
- A menu will appear, providing options to Edit.
- Remove the default entry and begin typing the desired references.

- As you type, suggested references will automatically populate in a dropdown menu.
- Select the desired measure from the dropdown menu.

- Confirm the selection by pressing Enter.

Multiple references can be entered in the header.

It’s also possible to consolidate all referenced measures into one by creating a unified measure and inserting only that in the Filters. This comes in handy when the report page is completed and no further changes will be done regarding adding filters/slicers on the page. The measure below was used to create a unified header.
Selected period = [SelectedQuarter_] & " " & [SelectedYear_]