Choosing the right plan for your needs is essential, which is why we offer four tailored pricing plans —each packed with specific features designed to help you get the most out of Zebra BI for Power BI. Whether you’re just getting started or need advanced capabilities, there’s a perfect plan for you. In this article, we’ll break down each pricing plan, highlighting the key features, benefits, and differences to help you choose the best option for your needs.
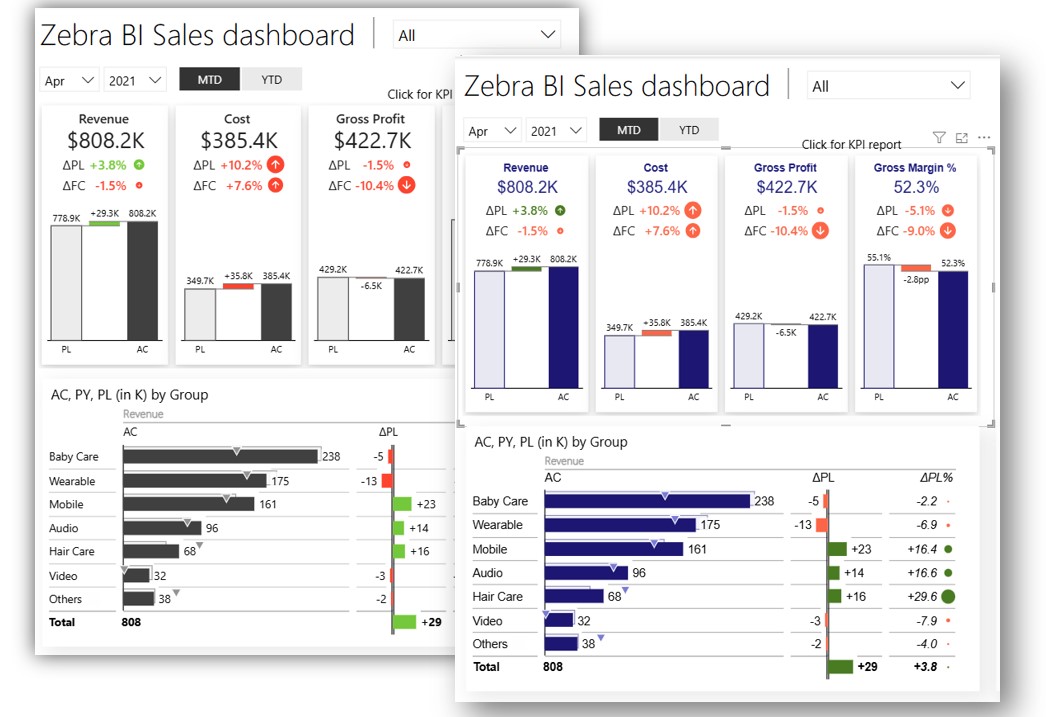
The Zebra BI for Power BI license covers all three Power BI visuals: Tables, Charts, and Cards.
Please navigate to this link to view pricing and purchase a license.
Power BI pricing plans
Free Plan
Number of Users: 1 user
✅ Included Features
- Fully IBCS Compliant
- Actionable Data Visualizations
⚠️Partially Available:
- Max 5 Cards (Cards)
- Chart types (Charts)
- Advanced Design Settings on ZBI Cards
– Only single card
– No Global toolbar in Cards - Automatic Variance Calculations & Performance Insights
– 1 comparison measure
❌Not Included:
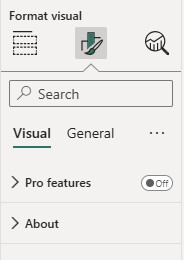
- Settings (side pane)
- Small Multiples and Stacked Charts (Charts)
- Table slider (Tables)
- Column header menu (Tables)
- Row right-click (Tables);
– Calculations,
– TopN,
– Formulas
– Formatting - Storytelling with Comments and Annotations
- Additional Measures
- Visual Interaction Controls & Flexibility
- Multiple Plan & Forecast Scenarios in Tables
- Custom Design & Branding
- Tailored Setup
Starter Plan
Number of Users: Max 10 users
✅ Included Features
- Fully IBCS Compliant
- Actionable Data Visualizations
- Settings (side pane)
- Small Multiples and Stacked Charts (Charts)
- Table slider (Tables)
- Column header menu (Tables)
- Row right-click (Tables);
– Calculations,
– TopN,
– Formulas
– Formatting - Unlimited number of Cards
- All chart types (Charts)
⚠️Partially Available:
- Advanced Design Settings on ZBI Cards
– No Global toolbar in Cards - Automatic Variance Calculations & Performance Insights
– 2 comparison measures
❌Not Included:
- Storytelling with Comments and Annotations
- Additional Measures
- Visual Interaction Controls & Flexibility
- Multiple Plan & Forecast Scenarios in Tables
- Custom Design & Branding
- Tailored Setup
Business Plan
Number of Users: Max 50 users
✅ Included Features
- Fully IBCS Compliant
- Actionable Data Visualizations
- Advanced Design Settings on ZBI Cards
⚠️Partially Available:
- Automatic Variance Calculations & Performance Insights
– 3 comparison measures - Storytelling with Comments and Annotations
– 2 comments - Additional Measures
– 2 additional measures - Visual Interaction Controls & Flexibility
– ON/OFF Interactions for viewers
❌Not Included:
- Multiple Plan & Forecast Scenarios in Tables
- Custom Design & Branding
- Tailored Setup
Enterprise Plan
Number of Users: Customizable
✅ Included Features
- Fully IBCS Compliant
- Actionable Data Visualizations
- Advanced Design Settings on ZBI Cards
- Automatic Variance Calculations & Performance Insights
- Storytelling with Comments and Annotations
- Additional Measures
- Visual Interaction Controls & Flexibility
- Multiple Plan & Forecast Scenarios in Tables
- Custom Design & Branding
🎇Also included with the Enterprise plan:
- Tailored Setup
– Hands-on onboarding
– Flexible payment options
– Enterprise-level support
Detailed Explanations of Limited Feature
General Free plan limitations
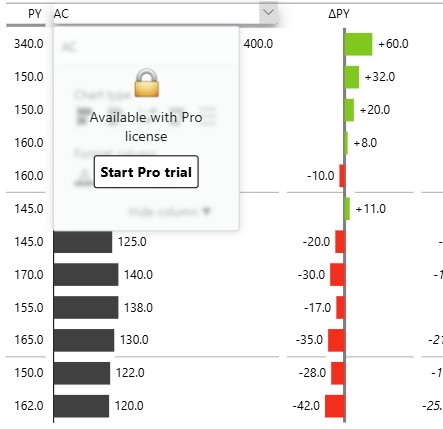
- No settings on Charts and Tables (side pane)
- Max 5 Cards in Cards
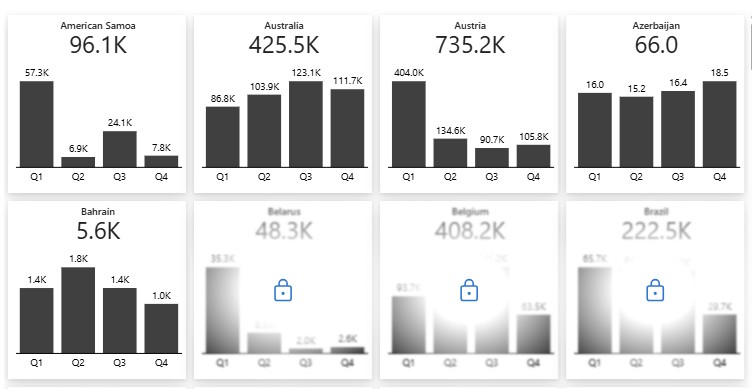
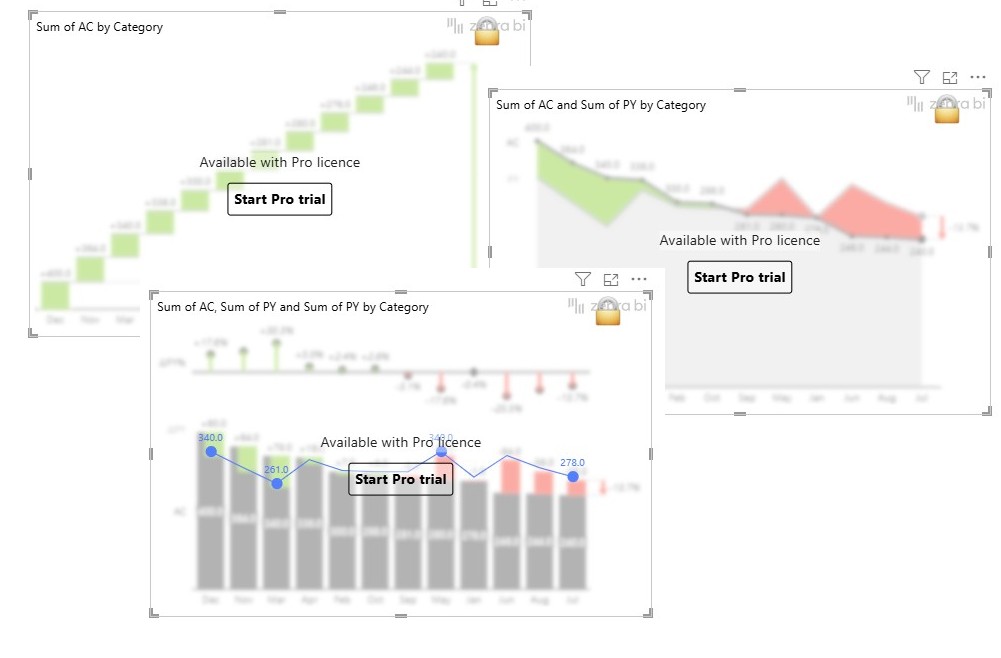
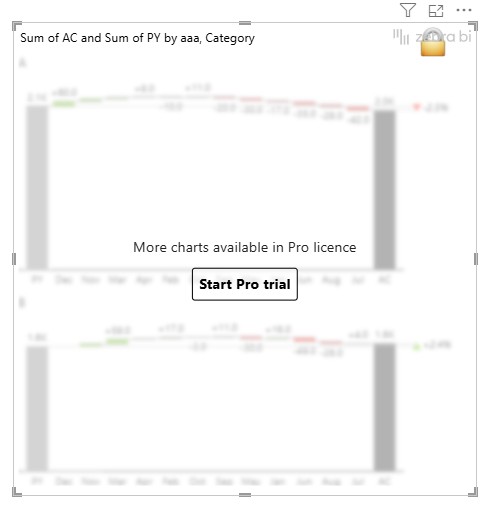
- Various chart types (Combo chart, Single measure waterfall, area chart)
- Small multiples and Stacked charts (Charts)
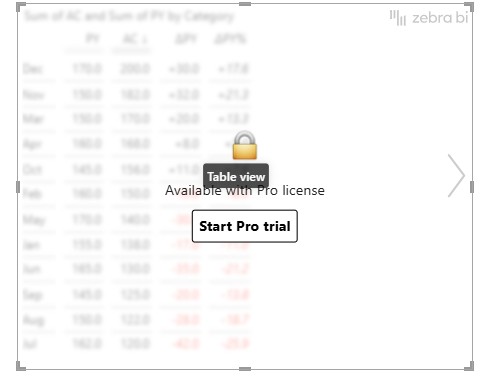
- Table view (Tables)
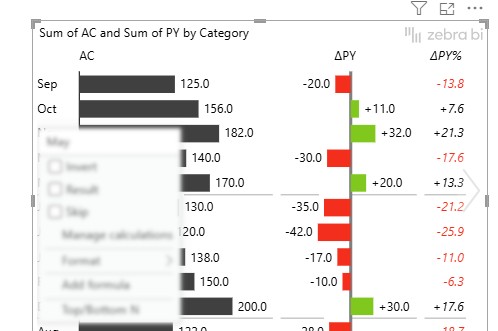
- On visual menus on Tables
– Row right click
– Column header menu
Advanced Design Settings on ZBI Cards
Limitations by Plan
- Free Plan:
- Only Single Card: Users can only use the single-card option in the Cards visual, with no ability to expand it to a multiple-card view
- Cards’ Global Toolbar Not Available: The global toolbar, which allows for consistent settings across multiple cards, is inaccessible. Users don’t have access to change card fonts, icons, or card style.
- Starter Plan:
- Cards’ Global Toolbar Not Available: Similar to the Free plan, the global toolbar remains inaccessible. Users don’t have access to change card fonts, icons, or card style.
- Business and Enterprise Plans:
- Fully Available: All advanced design settings and the global toolbar are accessible. Users can efficiently apply consistent styles across multiple ZBI cards, enhancing the overall aesthetics and coherence of their reports.
Impact on users
- Free and Starter Plans: Limited customization can result in less visually appealing and inconsistent reports, potentially affecting the clarity and professionalism of data presentations.

- Business and Enterprise Plans: Full customization capabilities enable users to create highly tailored and visually consistent reports, improving data communication and stakeholder engagement.

Automatic Variance Calculations & Performance Insights
Provides instant analysis of key metrics, highlighting significant changes and trends in your data. This feature enhances decision-making by offering actionable insights directly within your visuals.
Limitations by Plan
- Free Plan:
- One Comparison Measure: Users can compare only one measure against a primary metric. This allows for basic variance analysis but limits the depth of insights.
- One Comparison Measure: Users can compare only one measure against a primary metric. This allows for basic variance analysis but limits the depth of insights.
- Starter Plan:
- Two Comparison Measures: Users can add two measures for comparison, enabling more comprehensive analysis and a better understanding of data fluctuations.
- Two Comparison Measures: Users can add two measures for comparison, enabling more comprehensive analysis and a better understanding of data fluctuations.
- Business Plan:
- Three Comparison Measures: Users can compare up to three measures simultaneously, providing a deeper and more nuanced analysis of performance changes.
- Three Comparison Measures: Users can compare up to three measures simultaneously, providing a deeper and more nuanced analysis of performance changes.
- Enterprise Plan:
- Fully Available: No restrictions on the number of comparison measures. Users can perform extensive variance calculations and gain comprehensive performance insights across multiple metrics.
Impact on users
- Free and Starter Plans: Limited comparison measures may restrict the ability to uncover deeper insights and understand complex data relationships.


- Business and Enterprise Plans: Enhanced variance analysis capabilities allow for more detailed and
actionable insights, supporting better-informed business decisions.


Storytelling with Comments and Annotations
It enables users to add contextual notes and explanations directly within visuals. This feature facilitates collaboration, provides clarity, and enhances the narrative behind the data.
Limitations by Plan
- Business Plan:
- Limited to 2 Comments: Users can add up to two comments or annotations per visual. This may constrain the ability to provide detailed context or collaborative input on data points.
- Limited to 2 Comments: Users can add up to two comments or annotations per visual. This may constrain the ability to provide detailed context or collaborative input on data points.
- Enterprise Plan:
- Unlimited Comments and Annotations: Users can add an unlimited number of comments and annotations.
Impact on users
- Business Plan: Limited annotations may result in insufficient context or explanations, potentially leading to misunderstandings or the need for additional communications outside the visual.


- Enterprise Plan: Unlimited annotations foster thorough explanations and seamless collaboration, ensuring that all relevant insights and contextual information are captured within the visual.


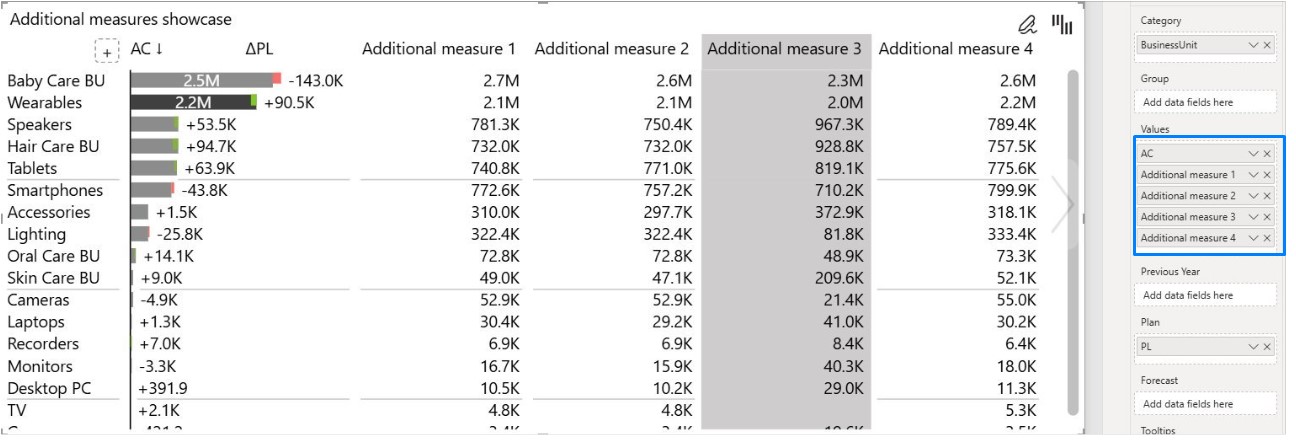
Additional Measures
Allow users to incorporate extra calculations and metrics into their visuals, enabling more complex and detailed data analysis. Additional measures are also a starting point for adding more attributes to your table as text columns.
Limitations by Plan
- Business Plan:
- Limited to two (2) Additional Measures: Users can add up to two additional measures per visual. This may constrain the ability to perform complex and customized analyses.
- Limited to two (2) Additional Measures: Users can add up to two additional measures per visual. This may constrain the ability to perform complex and customized analyses.
- Enterprise Plan:
- Unlimited Additional Measures: Users can include as many additional measures as needed, supporting extensive and multifaceted data analysis.
Impact on users
- Business Plan: Restricts the ability to perform complex analyses and limits the depth of insights that can be derived from the data.

- Enterprise Plan: Offers maximum flexibility for detailed and comprehensive data analysis, supporting advanced visualising needs.
Visual Interaction Controls & Flexibility
Designers have an option to define how viewers can interact with the elements within visuals. This includes enabling or disabling certain interactions to tailor the user experience.
Limitations by Plan
- Business Plan:
- Limited to ON/OFF Interactions for Viewers: Users can toggle specific interactions on or off, but lack the ability to customize the level and type of interactivity beyond basic toggling.
- Limited to ON/OFF Interactions for Viewers: Users can toggle specific interactions on or off, but lack the ability to customize the level and type of interactivity beyond basic toggling.
- Enterprise Plan:
- Full Control Over Visual Interactions: Users can fully customize how viewers interact with visuals, including advanced interaction settings such as drill-downs, filters, and dynamic data exploration. This provides a highly tailored and interactive user experience.
Impact on users
- Business Plan: General Interaction switch ON/OFF may limit the ability to create engaging and interactive visuals, potentially reducing user engagement and data exploration.

- Enterprise Plan: Comprehensive interaction controls enhance user engagement and enable dynamic data exploration, leading to more insightful and interactive visualing experiences.

Multiple Plan & Forecast Scenarios in Tables
Compare up to three plan and three forecast scenarios simultaneously to gain a 360° view of your organization’s future performance.
Available exclusively in Enterprise Plan
Impact on users
Feature empowers users with greater flexibility and agility by enabling them to compare multiple scenarios side by side, ensuring informed and timely decision-making, especially in uncertain times. It helps evaluate best-case, worst-case, and realistic scenarios side by side.

Custom Design & Branding
Allows the import of JSON themes to define and modify visual elements such as colors, fonts, labels, and layout settings, ensuring alignment with the company’s brand identity.
Available exclusively in Enterprise Plan
Impact on users
With JSON themes in Power BI, organizations can standardize and unify the appearance of all reports across thousands of users from a single central place.
- Updating report styles across the organization without manual changes.
- Providing a uniform look and feel, making reports easier to interpret.