Understanding how your dashboards and reports are used can help you measure their impact and optimize them for better performance. This guide covers monitoring usage metrics in Power BI, including who uses your reports and dashboards and for what purpose.
Introduction to Usage Metrics Report
When selecting this option Power BI generates a preconfigured report displaying usage metrics for that content over the last 90 days. This report is similar in appearance to standard Power BI reports. You can filter the data based on how your end users accessed the content, whether through the web or mobile app, and more. As your dashboards and reports evolve, the usage metrics report updates daily with new data.
Understanding usage metrics can help you:
- Demonstrate the impact of your content
- Prioritize efforts based on usage patterns
- Identify highly utilized reports and underutilized dashboards
Prerequisites
- A Power BI Pro or Premium Per User (PPU) license
- Edit rights to the dashboard or report (member, contributor or admin)
- Usage metrics are enabled by your Power BI admin, with optional per-user data collection
Note: The usage metrics report isn’t supported for My Workspace.
Setup
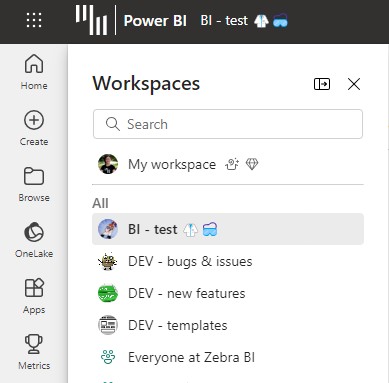
1. Open and sign into the Microsoft Power BI service (https://app.powerbi.com). Click on the Workspaces icon in the side ribbon and from the list select a workspace containing the report for which you’d like to see the usage metrics.
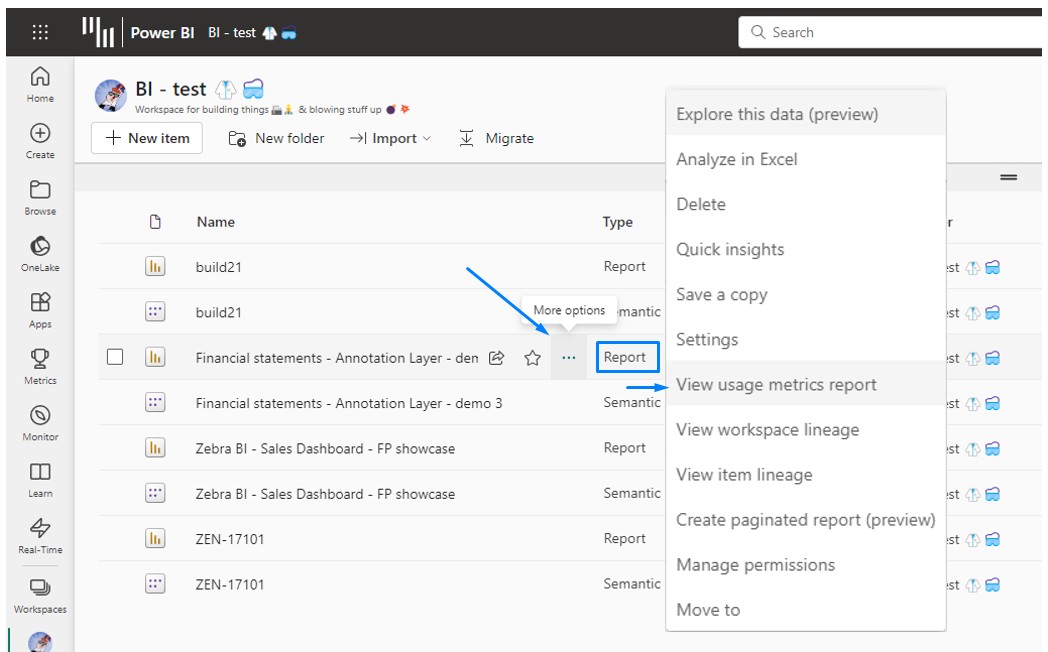
2. Browse for the report from the workspace content list, select More options (…) next to the report, and choose View usage metrics report.
3. Alternatively, you can first open the report and select More options (…) > Open usage metrics from the command bar.

4. The first time you do this, Power BI will create the usage metrics report and notify you when it’s ready.

5. To view the report, select View usage metrics.
- Power BI may prompt you to try the new usage report. Select Got it.
- (Optional) To enable the improved usage metrics report, toggle the New usage report switch in the upper right corner to On.

Explanation of the report
Below is a quick overview with explanations of some metrics within the report for easier understanding:

Saving a Copy
Use the “Save As” function to convert the usage metrics report into a standard Power BI report that you can customize to meet your specific needs. Even better, the underlying semantic model includes usage details for all dashboards and reports in the workspace, offering more possibilities. For instance, you could create a report comparing the dashboards in your workspace based on their usage.
Explore Usage Metrics for the whole workspace
It’s required the original usage metrics report is saved to get the option to “Edit” the report and access information for the whole workspace.
By default the report you created is filtered to the particular report you’ve created it from so the filter needs to be removed to get all reports in the workspace included.
1. To remove the filter go to “Edit“

2. Under the Filters pane, navigate to the “Filters to all pages” and clear the filter in the ReportGuid field.
New Usage Metrics Report
By enabling the above mentioned “New usage report on” you get an option for a different view of the metrics. It’s a slightly different usage metrics report which in general differs from the default one by:
- containing content for the last 30 days only
- has the option to immediatelly access metrics for the entire workspace
- includes more detailed and user-specific metrics
Explanation

Direct access to Usage Metrics Report for the whole workspace
When “New usage metrics report” is created it gets set on the “Report usage” page by default, which displays metrics for the specific report. To get the metrics for the whole workspace:
1. Go under “Pages” and select “Report list” page

2. Explore the Workspace metrics report, below you find a simple explanation of the KPIs.

Admin Controls
Global or Power BI administrators can control access to usage metrics. They can:
- Enable or disable usage metrics for specific users or the entire organization.
- Manage per-user data visibility.
- Delete all existing usage metrics content, which is irreversible.

Key Takeaways
The usage metrics report serves as a vital tool for understanding how your content is being utilized. The daily updates ensure that you always have the most current information at your fingertips, enabling you to respond promptly to emerging trends and user needs.
For a more detailed explanation of the usage metrics report, refer to the official Microsoft documentation using the links below.
https://learn.microsoft.com/en-us/power-bi/collaborate-share/service-usage-metrics
https://learn.microsoft.com/en-us/power-bi/collaborate-share/service-modern-usage-metrics