Building flexible and context-aware visuals in Power BI often requires going beyond static labels. With dynamic legends, your chart descriptions automatically adjust to reflect user selections—whether comparing plans, forecasts, or different scenario versions. By linking measures through the Filters pane, legends update seamlessly to match the data being displayed, keeping reports intuitive, consistent, and easier to maintain without manual edits.

How to add filter fields into the visual
When a visual is selected, go to the Visualizations pane and scroll down to the last placeholder called Filters.
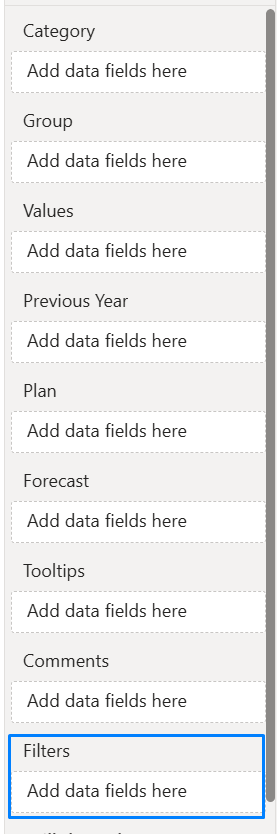
This placeholder can be populated with measures and dimensional attributes to read the Filters applied to the visual. You can create explicit measures to correspondingly display the desired outcome or insert any field in which you’d like to return the text in the header when it’s been filtered on the page. The second option will create an implicit measure that works only when a single value is filtered within the slicer or filter. Therefore, it’s better to make an explicit measure where everything can be defined correctly.
How to set up a measure
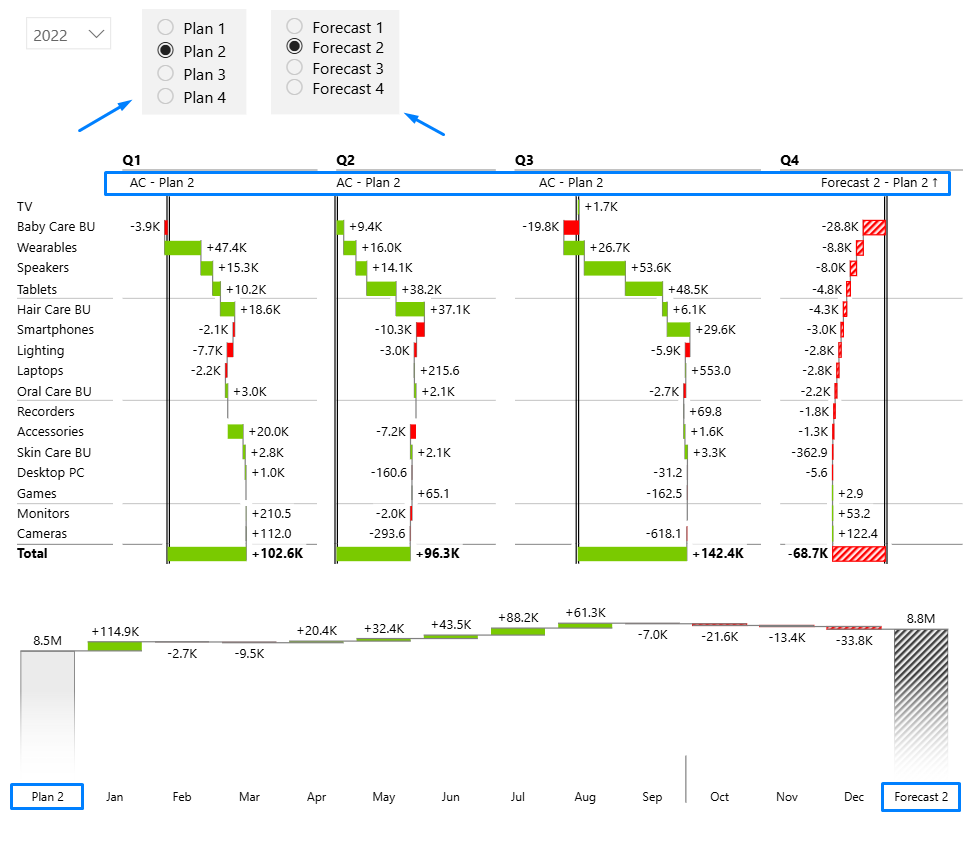
Below is a simple measure that can be used in this example. Say we want to compare values between different Plans and Forecasts. In the first quarter, we had the first plan, and then in the second quarter, we made some adjustments and imported the second plan, etc. These can now be easily monitored with the changing legends.
In this example, we’ve set up two fields parameters, each consisting various versions of Plans / Forecasts which will be used as a slicer on our report. Go to the Field parameters article to learn how to set this up. After you’ve set the fields parameters you can create a measure for selections.
Selected_PL = MIN('FP - Plan scenarios'[FP - Plan scenarios])

Selected_FC = MIN('FP - Forecast scenarios'[FP - Forecast scenarios])
Referencing a measure in the legend
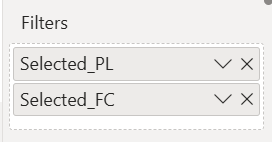
To establish a dynamic legend, add the measures you’ve created in the Filters bucket.
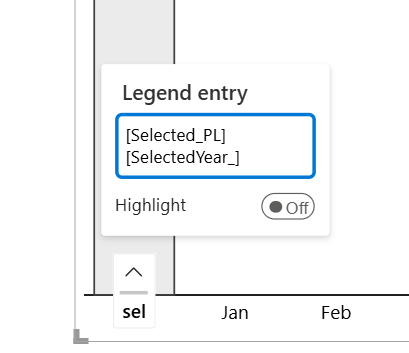
After that, hover over any legend entry in the visual until the arrow appears and click on it.

When the entry window opens you can delete the existing entry and start typing in the measure name you’ve prepared. As you type, suggested references will automatically populate in a dropdown menu.
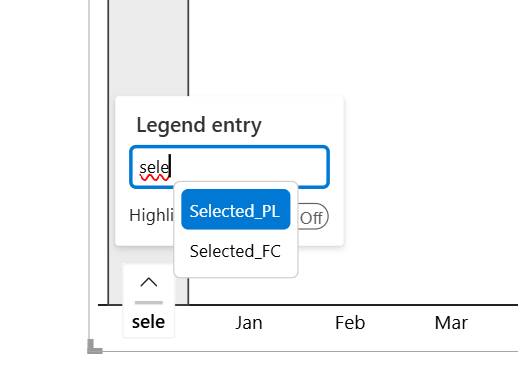
Select the desired measure from the dropdown menu and confirm the selection by pressing “Enter”. You can add multiple references if needed.
Once you’ve changed the entries in all legend names, you can seamlessly switch between different scenarios, which will respond with the corresponding names.

You can also take this concept a step further in Zebra BI Tables by using dynamic column headers. Instead of being limited to fixed column names, you can bind headers to measures in the same way as legends. This makes table layouts respond automatically to slicers and scenario selections, giving you even more flexibility to build fully context-aware reports that stay accurate and self-explanatory without manual relabeling.