While Power BI is an excellent tool for creating business reports, there is another option when you want to present these reports in an especially memorable way. Luckily, for the certified visuals, Microsoft enables embedding Power BI reports into MS PowerPoint. You can do so in just a few clicks.
Export a Power BI report to PowerPoint
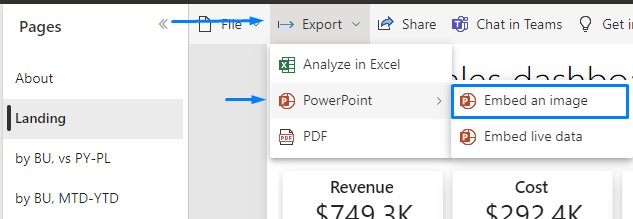
1. Log into your Power BI account, select the report you want to export, and click Export > PowerPoint.
You will be prompted with multiple choices about your export. Here you can customize values, decide if you want your file to include hidden report tabs, and, if you are interested in only one particular page, export only the page you are currently on.

2. A notification should appear about the exporting process.
Once it is done, the PPTX file will begin to download. Open the file after it’s finished.

3. Open your newly created PowerPoint document and click on Enable Editing to finalize your presentation.
This feature was enabled after Microsoft officially certified Zebra BI custom visuals for Power BI. Find more details about exporting your report pages to MS PowerPoint.
Watch how to export your reports into PowerPoint in just a few clicks.
How to embed Power BI in updatable PowerPoint slides?
There are, at the moment, some limitations to this feature, for example:
- It is only available in the Power BI service (you cannot do it from the Power BI Desktop).
- Exported PowerPoint slides are static pictures (you cannot refresh them in PowerPoint).
- You can only export one Power BI report at a time.
- The number of pages is limited (only the first 30 pages will be exported).
- Only certified custom visuals are supported.
- Python visuals, R visuals, and ArcGIS visuals are not supported.
The fact that PowerPoint slides cannot be refreshed and that you cannot create a PowerPoint slide deck from selected report pages from several different reports makes the Export to PowerPoint feature unfit for typical business use cases.
Embedding live Power BI report page into PowerPoint
The export option offers a second choice of embedding the live data directly on a PowerPoint slide.

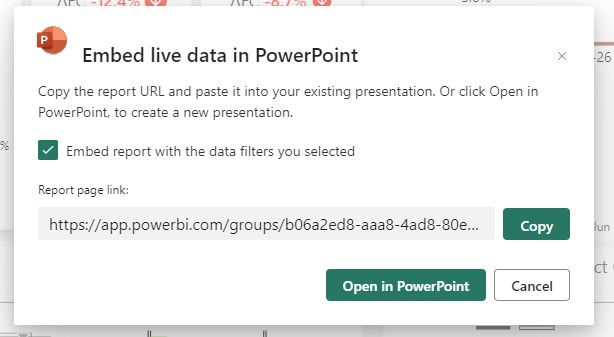
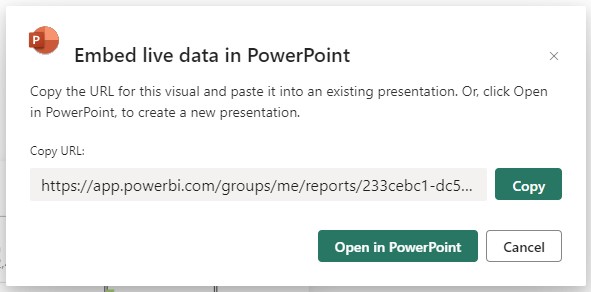
When this option is selected an additional window opens where you will get the URL of the report page. Copy the URL to paste into the Power BI PowerPoint add-in. Alternatively, if you want to create a new presentation with the report already loaded into the add-in, choose Open in PowerPoint.
Embedding a live visual on a PowerPoint slide
A live visuals URL is required if you wish to use it in your presentation. Following are the simple steps to obtain a visual’s URL.
- Open the report to the page that contains the desired visual in the Power BI service. Use filters, selection, slicers, and other configuration options to set the visual up as needed.
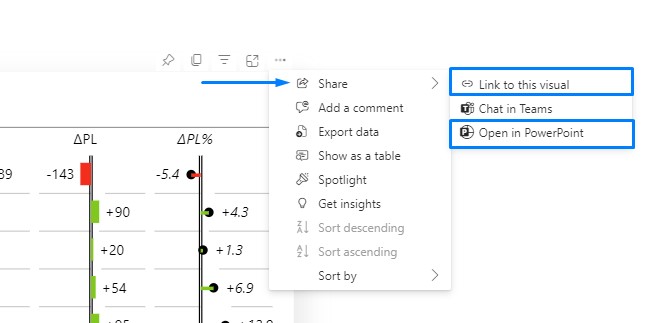
- Go to More options (…) and:
– Hover over Share and choose Link to this visual to get the visual’s URL, if you’re adding the visual to an existing presentation. After you’ve copied it, paste it into the Power BI PowerPoint add-in.
– When you want to open a new presentation with the visual already loaded into the add-in, choose Open in PowerPoint.
Select Open in PowerPoint from the Embed live data in PowerPoint dialogue that displays. With the visual already loaded into the add-in, this launches a fresh PowerPoint presentation.
Insert a report or visual URL into the add-in
- Open a PowerPoint file and find the slide on which you wish to add the report or visual.
- Go to the Home tab and click on the Add-ins button. When clicked, a dropdown menu appears with all your existing Add-ins and an option to browse for new Add-ins -> Get Add-ins
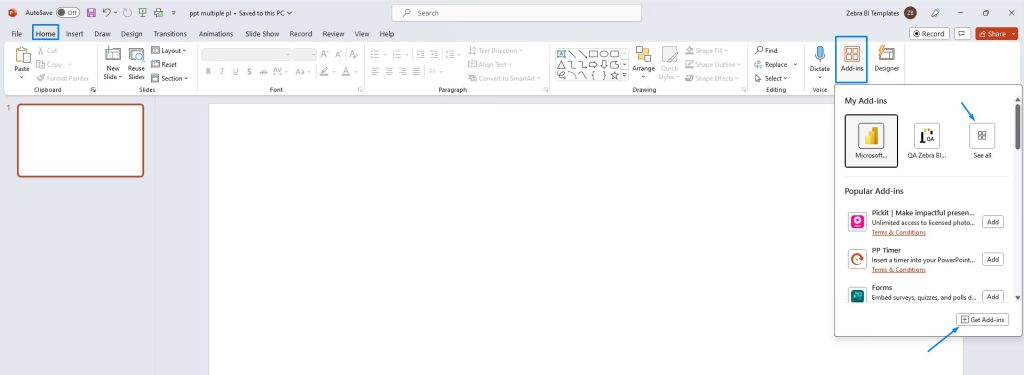
By clicking on See all you will be able to see the whole set of your saved add-ins
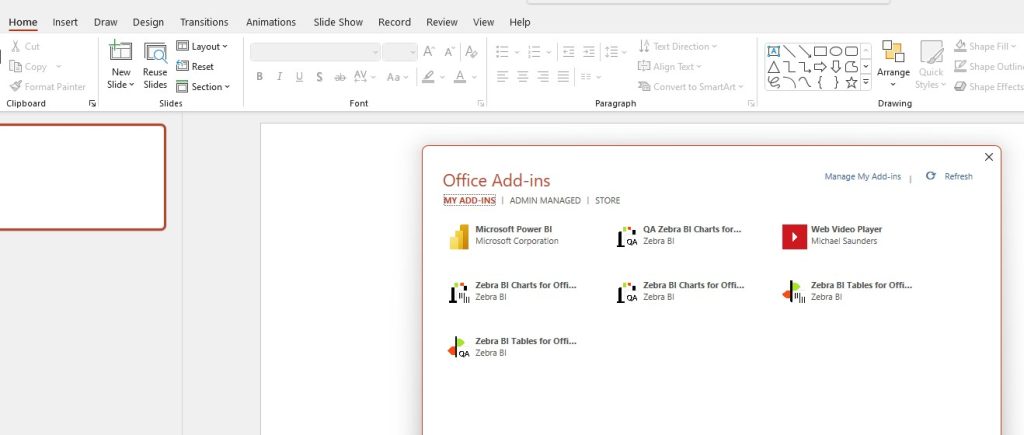
Select Microsoft Power BI add-in and insert the link you copied from the report or visual in the Power BI Service
The report or visual is live after it has loaded, and you may choose the data you want to use. Your changes will be saved as you make them while editing the presentation. The report or visual will reopen in the same state as when you last closed the presentation.