To get the most out of the Zebra BI visuals, you have to make sure to have some basic DAX Measures available in the data model. Measures contain calculations and are used in Power BI visuals to display data. There are over 200 different DAX functions ranging from the simple SUM function to very complex functions. The measures described below will most likely be part of most of your Power BI reports.
Basic Measures include Actuals, Plan, Previous Year, and Forecast. For demonstration purposes, we have used a simple and small data table. Let’s take a look at the Sales table:
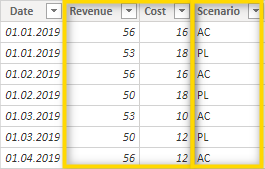
Note that we have a column that indicates which scenario the data corresponds to. In this case, we have AC (Actuals) and PL (Plan). In the sample data, there is no forecast data but the logic to create the forecast measure is identical to the measures we’ll set up in this article. In this specific case, 2 KPI (Revenue and Cost) columns are included in the data. There are other cases where all accounts/KPIs are defined in the same column. Zebra BI can handle all these different cases, the measures just need to be defined differently.
Create a Measure
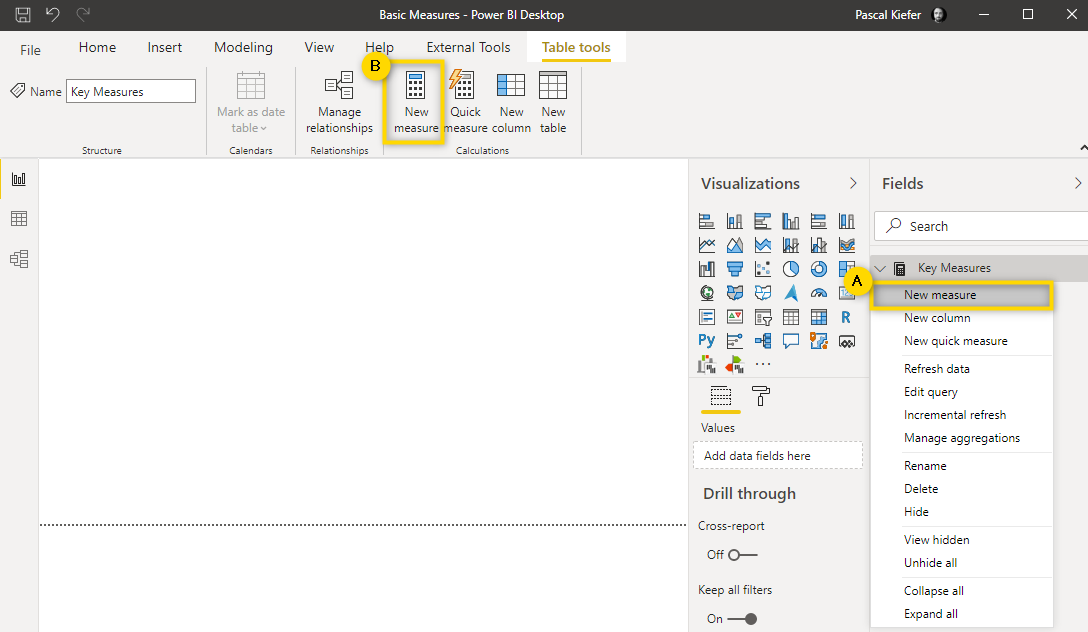
There are different ways of how a new Measure can be added. We recommend option A from the picture below where you right-click the table in which you want to add the Measure and then select New measure. Creating a measure like this assures that it is created in the correct table. Option B would be to simply click New measure in the menu on top of the screen.
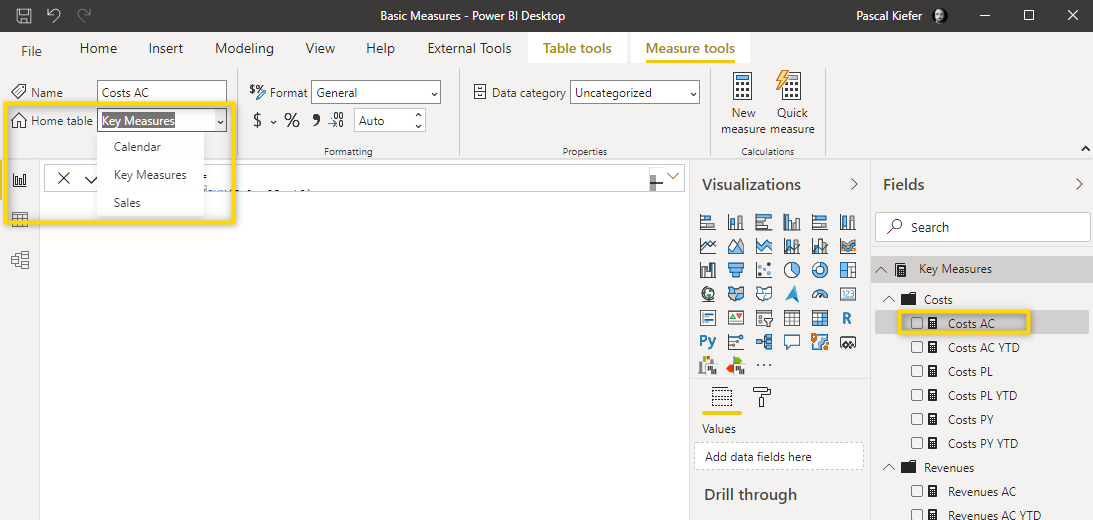
In case you want to move a measure from one table to another, simply select the measure from the Fields and change the Home table from the drop-down.
Use abbreviations
It’s easier to keep an overview of your measures when you name them properly. One way to do this is to use abbreviations. Here are some of the abbreviations that we normally use:
- AC = Actuals
- PL = Plan
- FC = Forecast
- PY = Previous Year
- YTD = Year-to-date
The measure for Actuals Revenues looks like this:
Revenues AC = CALCULATE(SUM(Sales[Revenue]), Sales[Scenario]="AC")
This function can be broken down in the following parts:
Revenues AC =
This is the name of the measure
SUM(Sales[Revenue])
Sum of all values that are in the column Revenue of the Sales table
Sales[Scenario]="AC"
Filters all rows in the Sales table when the value in the Scenario column in AC
CALCULATE
CALCULATE is used to combine the previously explained parts of the function. The main calculation within the CALCULATE function is SUM(Sales[Revenue]), which is then filtered to only the rows for which Sales[Scenario]=”AC” is true.
According to this logic, the measure for plan costs would be:
Costs PL = CALCULATE(SUM(Sales[Cost]),Sales[Scenario]="PL")
To calculate the previous year’s value, the already created measures can be reused. Because the previous year calculation is a time-intelligence function, a proper calendar/date table is needed. In the article calendar table, you will learn how to create such a table and add it to the report. The measure for Revenues PY looks like this:
Revenues PY = CALCULATE([AC Revenues],DATEADD(Calendar[Date],-1,YEAR))
This function can be broken down into the following parts:
Revenues PY =
This is the name of the measure
CALCULATE([AC Revenues]
The AC Revenues part refers to the basic measure that you should have created previously. Reusing simple measures in more complex ones is called measure branching and is considered best practice in Power BI. The CALCULATE means that some additional logic is added to this part of the function
DATEADD(Calendar[Date],-1,YEAR))
With the DATEADD function, you can display past (or future) data by adding a specific offset interval to the base measure. In this case, the formula says -1 year. In case you wanted to see the Actuals Revenues from 3 months ago, you would adjust this part of the function to look like DATEADD(Calendar[Date],-3,MONTH))
Now let’s create a year-to-date (YTD) measure.
Again, this is a time intelligence function and only works properly with a calendar table. This is the formula for the YTD of Actual Revenues:
Revenues AC YTD = CALCULATE([Revenues AC],DATESYTD(Sales[Date]))
Like in the previous year measure above, the main function you use is CALCULATE and combine it with DATESYTD. In the DATESYST it’s important to add the dates column from the calendar table and not the one from the facts (Sales) table.
You now have created some basic DAX measures in Power BI and can use them in the Zebra BI visuals. Note that the Zebra BI visuals contain 4 placeholders for measures. Go ahead and add your newly created measures into the appropriate placeholder in the Zebra BI visual and see if the measures work correctly. DAX can handle very complex calculations and your measures will also get more complex with some practice.
Luckily, the Power BI online community contains a lot of articles about complex DAX functions and if there’s no answer to your specific question, simply ask the community for help.