In addition to the familiar row calculations, Zebra BI Tables now supports using predefined calculations from your data model. This eliminates the need to manually add the same calculations to each visual, saving your time for more important tasks. Now, whenever you add a field or measure with predefined calculations for a specific context, they will automatically appear in the visual.
How do you enable or row calculations from model
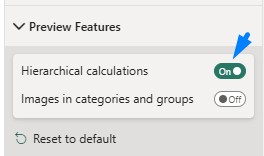
Since this functionality is still part of the Preview Features, you must first activate it:
- Go to Settings → Preview Features.
- Enable Hierarchical Calculations by switching it ON.
Once enabled, the visual will recognize and apply model-based calculations automatically.
Prepare row-level calculations in the model
To set up calculations in your model:
- Calculations must be mapped 1:1 and set as a dimension attribute.
- Each hierarchy level must have its own attribute.
- You can apply calculations using the following symbols:
| Calculation symbol | Description |
| / | Skip |
| – | Invert |
| = | Result |
Or combine symbols to reach a double effect, e.g., Invert and Result, which is a common situation.
| Calculation symbol | Description |
| -= | Invert and Result |
| /= | Skip and Result |
The order of calculation characters doesn’t matter; all combinations are supported (-=/), and the symbols can appear anywhere in the string, and the visual will recognize it.
In practice, this means you need an additional column to define a calculation based on the item in the row.
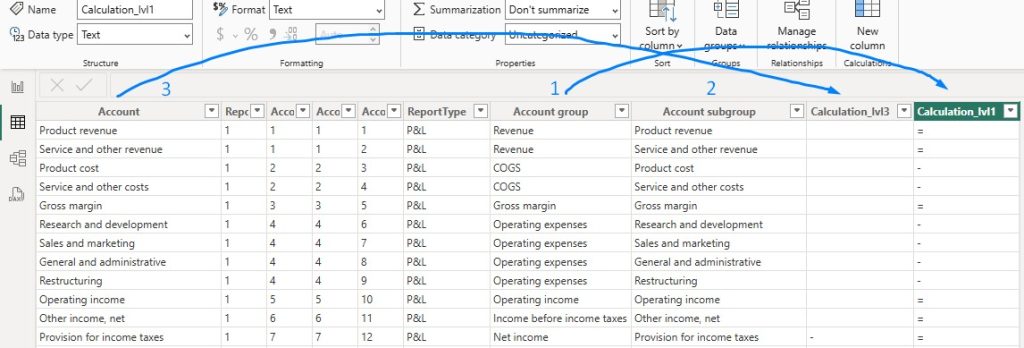
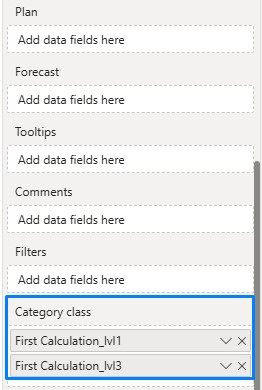
For example, as shown below, two additional columns (Calculation lvl1 and Calculation lvl3) define how calculations are applied at different levels using the above symbols.
If your hierarchy includes multiple levels:
- Every level must have a definition in the data model.
- You have the flexibility to apply a calculation only at the top level, and it will cascade to lower levels automatically.
- If calculations differ at a specific node, they must be defined separately.
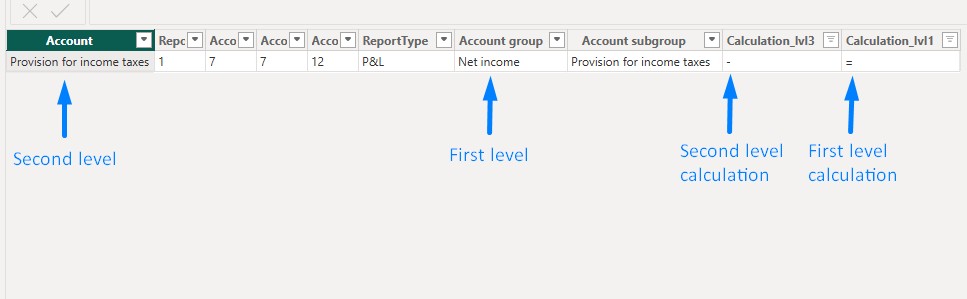
Example:
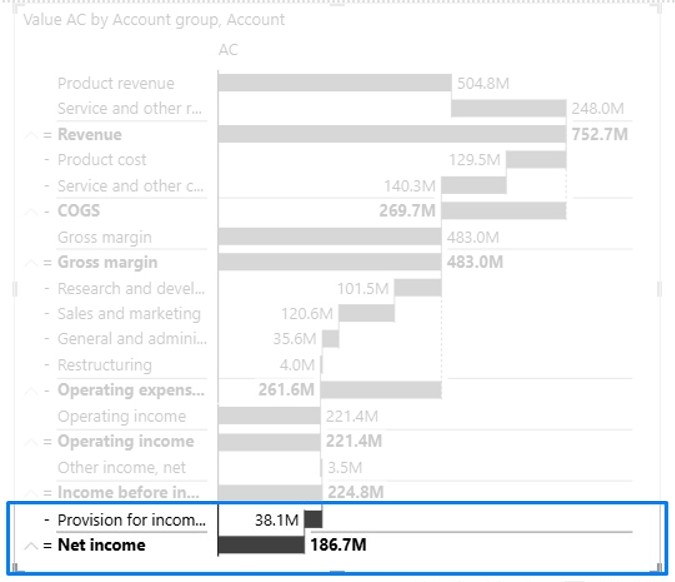
- The top-level node “Net Income” is marked as
= "Result". - The second-level node “Provision for Income Taxes” is marked as
- "Invert“, because it should not be added but subtracted.
Once you have the definition columns ready, insert them into the Category Class bucket of the Zebra BI visual.
Which, in this particular case, renders as this below:
Note: You won’t be able to insert a field if you are using Calculation groups in your data model(see: MSFT documentation on Calculation group limitations). In this case, you can create an explicit measure that returns an equivalent result to the implicit measure aggregation.
Explicit measure = SELECTEDVALUE('Accounts calc'[Calculation_lvl1])Alternative: Define Calculations Using a Measure
Another option is to apply calculations directly via a DAX measure, instead of using additional attributes.
Example DAX formula:
Dax Calculation = SWITCH(SELECTEDVALUE('Accounts calc'[AccountGroupID]),
"1","=",
"2","-",
"3","=",
"4","-",
"5","=",
"6","=",
"7","=")
In this case, you define the logic inside a measure and can place it into the Category Class bucket.
This method is useful if you only need one level or want more dynamic control using functions like ISINSCOPE() for multiple levels.
Applying Calculations Globally: Dynamic Behavior Based on Slicer Selections
Beyond row-level calculations, you can use the feature for global control — for example, to invert the sign of variances based on slicer selections.
Example: Handling KPIs with Inverted Logic
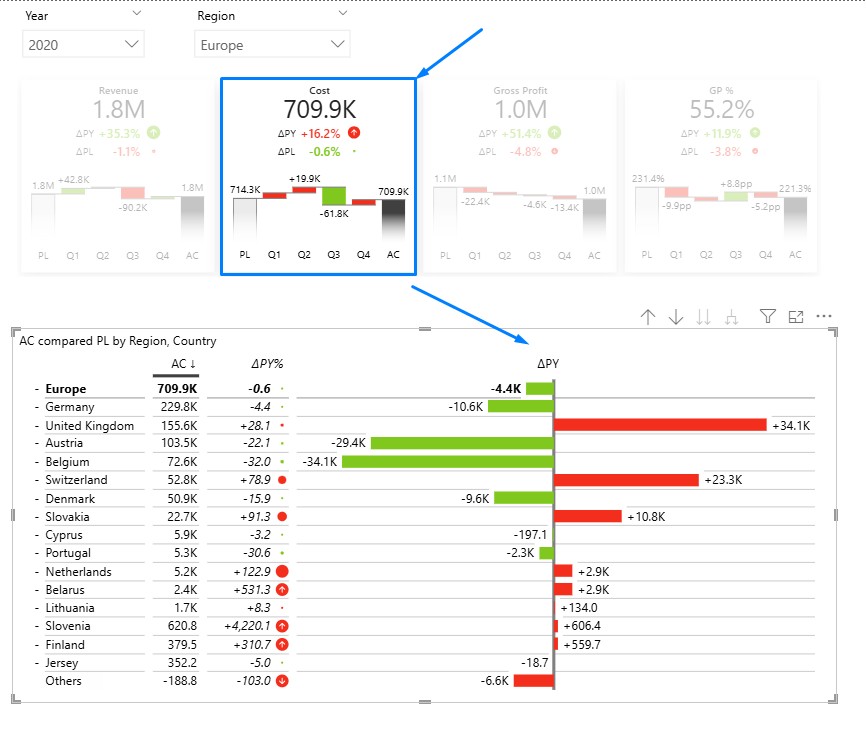
When a KPI like Cost or Expenses is selected (where positive variances have negative impact), you would want all visuals filtered by this KPI to invert their behavior automatically.
When selecting the KPI card “Cost”, the Zebra BI Tables below automatically inverts:
How to Set This Up:
- Create a DAX measure that defines the modifier logic:
KPI modifier = SWITCH(MIN(KPIs[KPI_ID]),
1,"", --Revenue
2,"-", -- Cost
3,"", --Gross Profit
4,"") --GP %
2. Insert this measure into the Category Class bucket of the visual.
This ensures that all related visuals react dynamically to user selections, displaying data correctly for KPIs with inverted meanings.
Conclusion
By enabling row-level calculations directly from the data model, you will gain faster reporting processes, and significantly more scalable solutions. Instead of manually configuring calculations for each visual, everything is now defined once – in one central place – and automatically applied across your reports.
This approach not only saves valuable time but also ensures consistency: everyone is working from the same source of truth. Whether updating calculations, adjusting hierarchy levels, or applying business logic, changes are handled in the data model, keeping your reports accurate, standardized, and easy to maintain.
Ultimately, model-based calculations help you shift focus from repetitive manual work to what matters most – delivering insights and making better business decisions.