This article explains the different display and calculation settings you can apply in Zebra BI Tables.
Each section covers what the feature does, how it affects your visuals, and how it impacts calculations — so you can choose the right settings for your data.
These features are designed to help you:
- Present metrics in a way that matches their real-world meaning.
- Highlight good or bad performance visually.
- Keep calculations accurate and consistent, even in complex tables.
Applying calculations
You can access row calculations by right-clicking on a row and selecting one of three options:
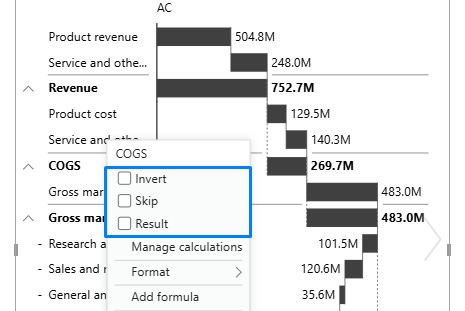
Invert
The Invert option lets you flip the meaning of a metric so that it’s treated as “negative” instead of “positive” (or vice versa) in your reports and charts.
For example:
- Revenue is good when it goes up.
- Costs are bad when they go up — even though the raw numbers are positive.
By inverting costs, your visuals and calculations will reflect that an increase in costs is negative.
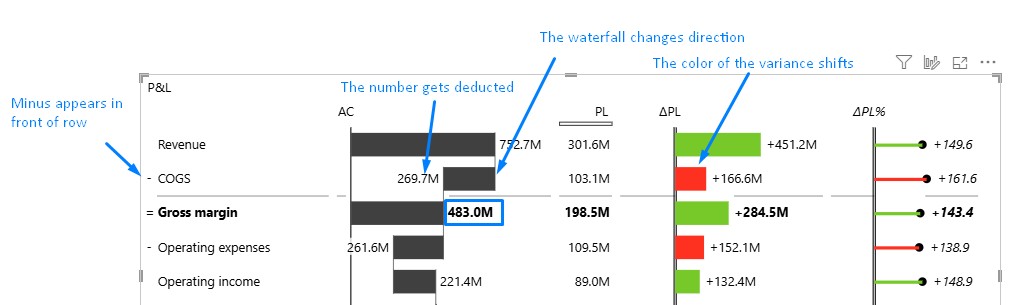
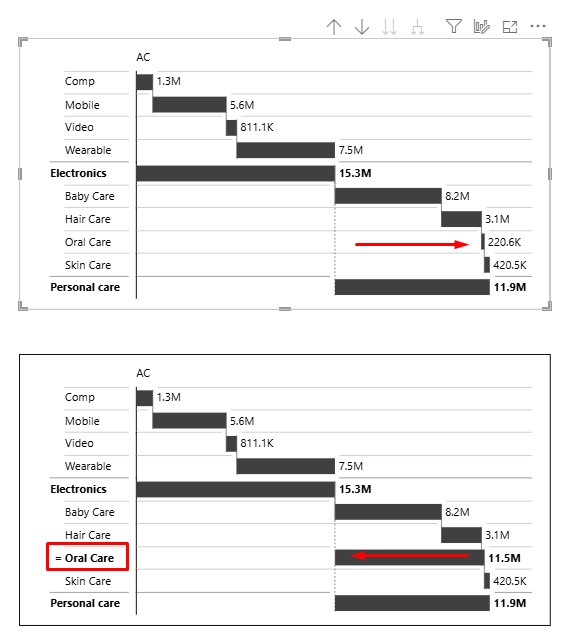
What Happens When You Invert a Row
When a row is inverted:
- A “−” sign appears in front of its category name.
- Colors are flipped in variance charts — red becomes green, and green becomes red.
- Waterfall chart direction flips — an upward bar becomes downward, and vice versa.
- Calculations change so that the inverted value is deducted instead of added.
- The raw number in the table doesn’t turn negative — for example, 156 stays as “156” but is treated as −156 in the calculation.
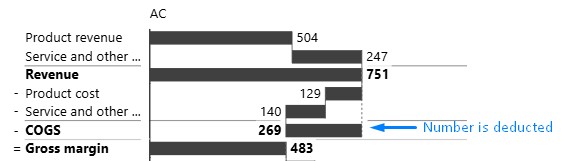
Invert in Hierarchical Tables
In child rows (rows taken directly from your data model), inverting works exactly as above.
In parent rows (totals or groups):
- The system first calculates the parent total from its children.
- If the parent row is inverted, the total is multiplied by −1, and a “−” sign is shown in front.
- Example:
- COGS children: −129 − 140 = −269
- Inverting COGS changes the display to “269” with a “−” sign in front of the row, but in higher-level totals, it still counts as −269.
Result
The Result option lets you display a cumulative total for a hierarchy item by summing up all of its siblings that appear above it. This is useful for showing progressive totals in tables and waterfall charts — but it requires the data to stay in the correct order for calculations to remain accurate.
How Results Work
A Result row shows the running total up to that point in the hierarchy.
The calculation always depends on the order of rows — so if sorting is changed, the Result can display incorrect values.
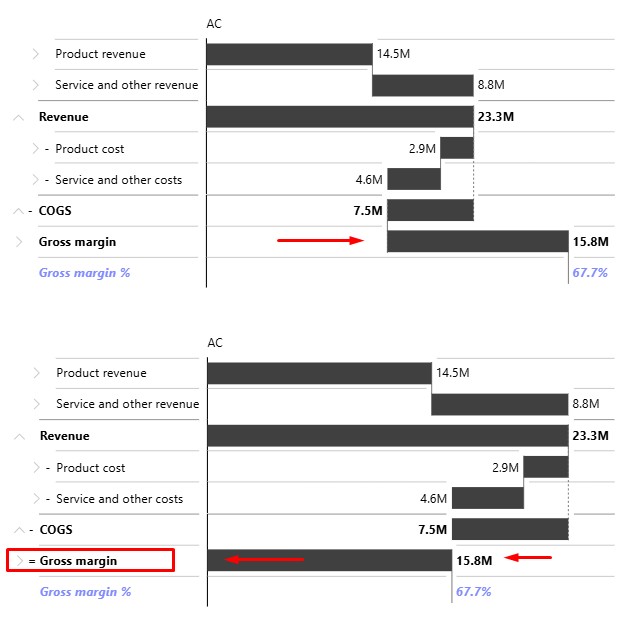
Standard example
In a waterfall chart, the bar resets its baseline to reflect the cumulative total at the result point.
- At the top-level result, the bar resets to
0.

- At a child-level result, the bar resets to the ending point of the last sibling above it.
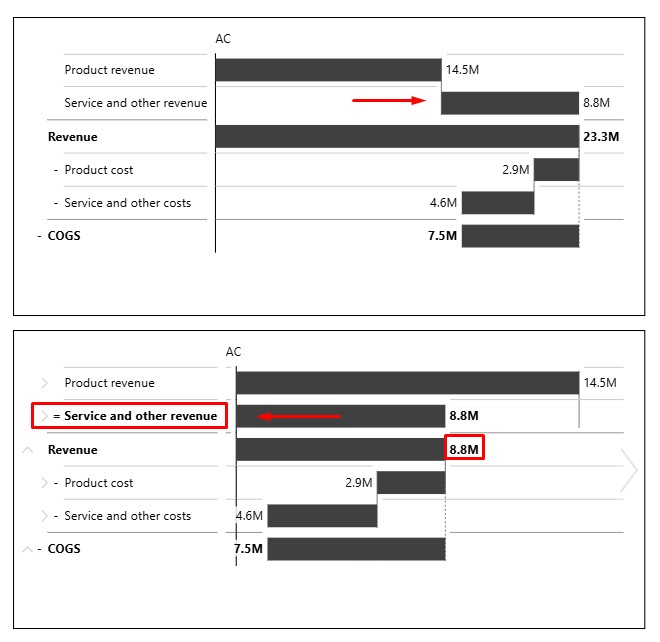
Ragged hierarchy example
A ragged result happens when a hierarchy has missing or uneven levels. These results reset the running total to the value stored for the ragged result in the dataset and restart row-level calculations from this point onward.
Impact on subtotals:
- Siblings above the ragged result at the same level are discarded (not included in the subtotal).
- The subtotal starts with the ragged result value and then adds any siblings below it.
Top-level result: Resets the entire hierarchy, including the grand total.
Child-level result: Only affects the parent subtotal.
You can explore more about handling ragged hierarchies in this article.
Sorting Rules
Correct sorting is critical for accurate results.
- Manual sorting inside visuals
- Disabled automatically when a Result is applied.
- Disabled automatically when a Result is applied.
- Power BI default sorting
- Still active outside of the visual.
- Changing this sorting can break result calculations.
- You should not change sorting when working with Results.
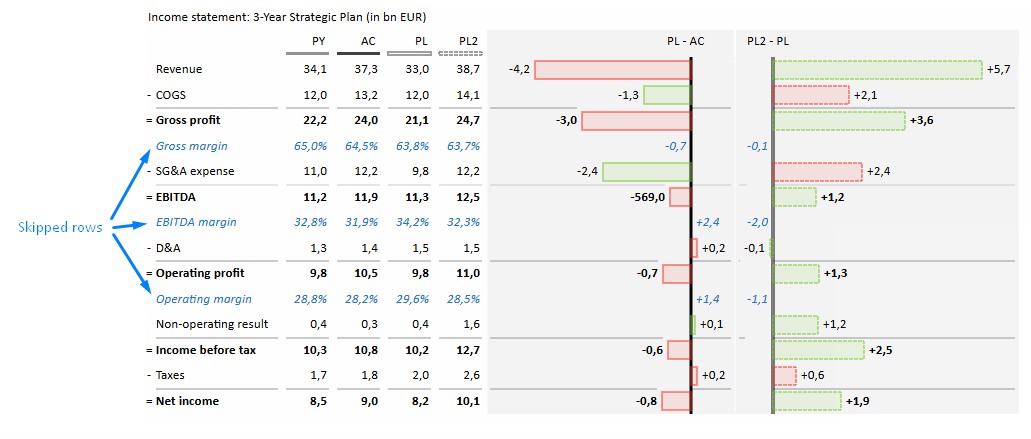
Skip
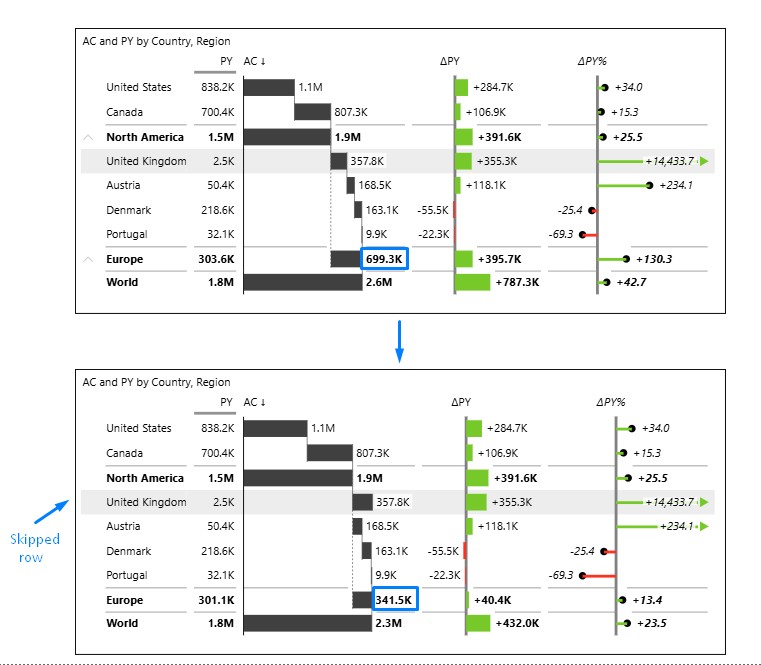
The Skip option lets you exclude a row from subtotal and grand total calculations while still keeping it visible in your table or chart. This is useful when you want to display certain data for reference but don’t want it to affect totals or cumulative calculations.
How Skip Works
Calculations:
- Skipped rows are ignored in subtotal and grand total calculations.
- If all child rows of a parent are skipped, the parent displays a value of NULL.
Waterfall Charts:
- The skipped row is drawn normally.
- The next sibling starts from the last unskipped value above it — the skipped row does not influence the bar’s progression.
Interaction with Results:
- Skipped rows are excluded from row-level result calculations.
- Cumulative sums ignore skipped rows.
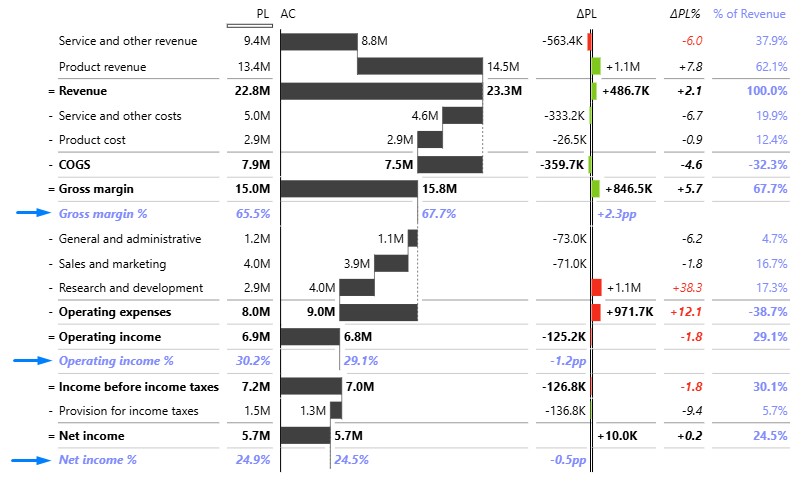
Important: Skip is always automatically applied to custom calculated formulas.
Example
Adding custom calculated formulas to the visual lets you skip those rows in subtotal and total calculations, which is especially useful when the calculations aren’t directly comparable unit-wise
Formulas
The Custom Formula option lets you create a row with your own calculation directly in the visual. This allows you to combine existing values in the table using basic math operations, without needing to change the underlying dataset.
How Formulas Work
- Build formulas using basic mathematical operators:
+,−,*,/ - Reference numbers that already appear in the visual.
- Add extra calculated rows for analysis without modifying the data model.
How It Affects the Visual
- A new row is added that shows the result of your custom calculation.
- By default, the row is marked as Skipped so it does not affect subtotals or grand totals.
- Aside from being skipped in totals, the row behaves like any other row in the hierarchy (it can be styled, inverted, etc.).
Important: The formula row remains tied to the row it was created on, so it cannot be repositioned.
Binding to Hierarchy Levels
A custom formula only exists at the hierarchy level where it was created.
It does not automatically copy to other levels of the hierarchy.