Learn about Zebra BI key features, ways to visualize your data, our reliability, pricing, and certifications.
Key Features
Zebra BI visuals for Power BI are one of the most powerful custom visuals. They are officially Microsoft-certified and offer a variety of features for advanced data visualization that make reports and dashboards understandable and actionable. Zebra BI offers:
- Three Power BI visuals: Charts, Tables, and Cards with many functionalities to cover all your data visualization needs and make your reports stand out;
- Free and paid version for all visuals;
- Free Live Webinars and other educational resources so you never feel alone;
- A Support team dedicated to constantly improving our visuals with new features, providing technical support, and making sure you’re getting the most out of your Power BI.
Zebra BI Tables, Charts, and Cards visuals
Zebra BI consists of three visuals: Zebra BI Charts, Tables, and Cards. You can access and install all of them directly from AppSource, just like any other add-in for Power BI. For a more detailed guide about the installation process, you can check the initial setup guide.

Zebra BI Tables visual lets you build extremely flexible tables with embedded charts. It works perfectly for sales variance reporting, financial statements, cost breakdowns, income statements, and more. The visual automatically calculate absolute and relative variances, saving you weeks in developing advanced reports.

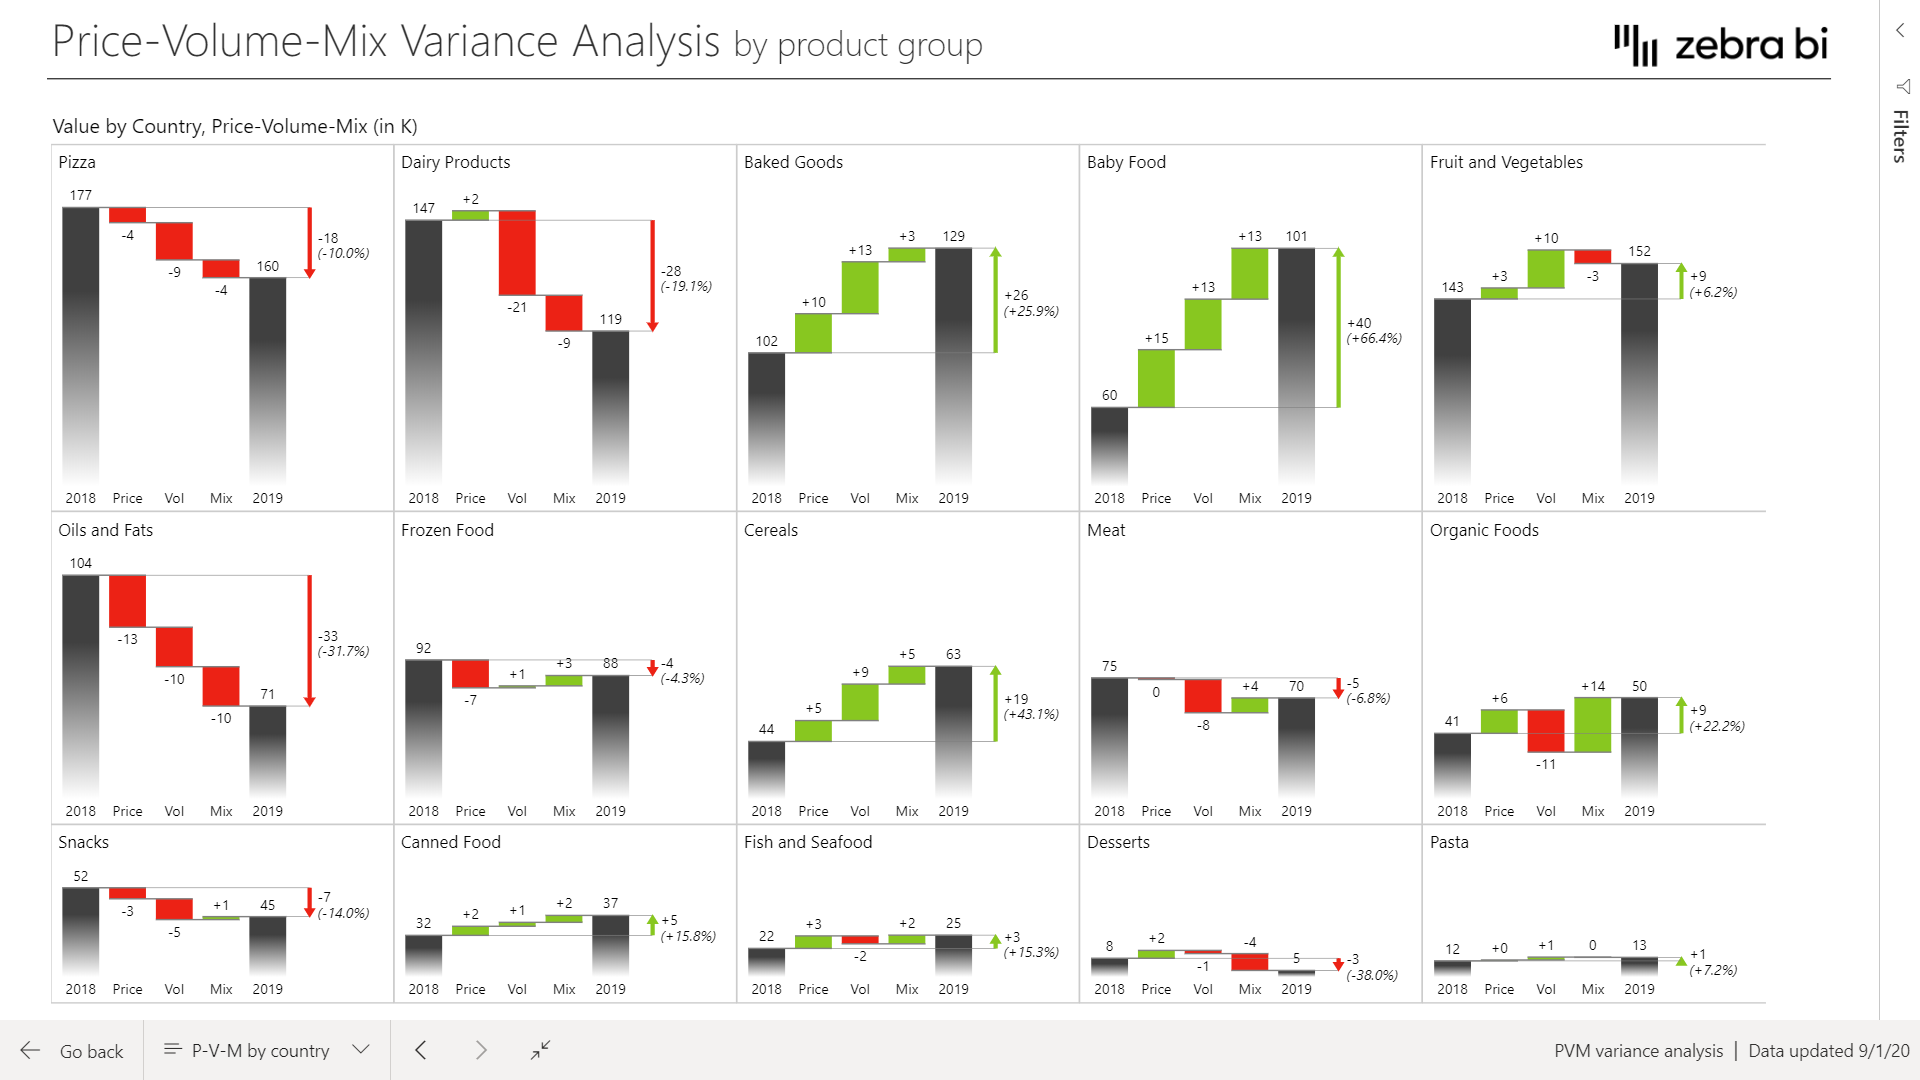
Zebra BI Charts visual renders the charts best fit for your report: waterfall, variance, column, area, line, dot, lollipop, “hills & valleys”, and many other types. You can easily create combination (combo) charts and above all, create small multiples of any chart type. Like Tables, Charts visual is fully responsive and can automatically calculate PY, plan or forecast variances, YoY growth rates, and totals.

Zebra BI Cards visual allows you to present your KPIs or scorecard in a powerful way and gain immediate insight into the most important metrics of your company’s performance. Create KPI cards that show comparisons and trends with just a few clicks. More context and explanation can be added with the help of advanced features like Scaled groups, Drill-through, Focus mode, Dynamic comments, and more.
Microsoft and IBCS-certified visuals
Zebra BI Charts, Tables, and Cards visuals have been officially certified by Microsoft as part of a rigorous review process, meaning they are fully compliant with Microsoft security, provisioning, and other technical standards and adhere to Microsoft requirements for enterprise deployment. Learn more about
certification.
Zebra BI Charts and Tables visuals are also certified by IBCS Association and are compliant with its reporting standards. This means that in Zebra BI visuals, business information is presented clearly, concisely, and consistently across the cloud, mobile, and desktop versions of Power BI (more about IBCS). We honestly believe that simply trying Zebra BI software will convince you just how powerful and useful it can be.
Our reliability and dedication to excellence are one of the main reasons why are our visuals used by thousands of business analysts around the world and are the #1 reviewed add-in for financial and sales dashboards in AppSource.
Among Philips, Coca-Cola, Bayer, FedEx, and many others, even Microsoft is using Zebra BI visuals for internal reporting. See a list of our happy clients.
Straightforward Pricing
Depending on the type of company you’re coming from and the number of people who design and view or engage with your Power BI reports, your needs may vary. Because of this, Zebra BI offers different pricing plans, from the free but limited version to the PRO version for smaller teams and up to large enterprise deployments.
Calculate your Zebra BI pricing →
Learn more about how our licensing works.
Where to go for help
In this knowledge base, you’ll be able to see many more deep dives into Zebra BI’s features and step-by-step tutorials to help you build the best reports with Power BI and Zebra BI. Go ahead and explore further! We recommend you check this list of helpful resources.