Zebra BI is presenting new visual variants Zebra BI Tables+ and Charts+(coming soon), that enable Power BI report viewers to add data-point-level comments directly on visuals, without requiring edit permissions.
This solution enables users to collaborate directly within Power BI reports while keeping all data secure and within your Microsoft 365 environment.
Key principles
✅Comment directly on report data
-> Users can add comments to specific data points—such as individual months, categories, or variances—directly within Power BI reports. This makes discussions more precise and context-driven.
✅No dataset refresh required
-> Comments are stored in Excel files hosted on SharePoint within your Microsoft 365 tenant. Using the Microsoft Graph API, comments are written and retrieved in real time, eliminating the need for dataset refreshes.
✅Seamless permission management
-> Access to comments is controlled through your existing Microsoft 365 and SharePoint permissions, so you can rely on familiar access controls without additional setup.
✅Data stays within your tenant
-> All comment data remains within your Microsoft 365 tenant and is governed by your organization’s data residency, security, and compliance policies.
ℹ️Once the prerequisites are met, you can start using this option in your reports. Please forward a link to the article below to your IT Administrator.
https://help.zebrabi.com/kb/power-bi/viewer-commentary-it-prerequisites/
Access and Permissions Model
Report access and comment participation are managed separately, giving you more flexibility in how users interact with reports and discussions.
- Power BI permissions determine who can view, edit, and publish reports, ensuring that report access follows your existing governance model.
- SharePoint permissions define who can add, view, and manage comments. This allows you to include additional stakeholders in discussions without granting them full report access.
Report Editors
Open and sign into Power BI – https://app.powerbi.com/
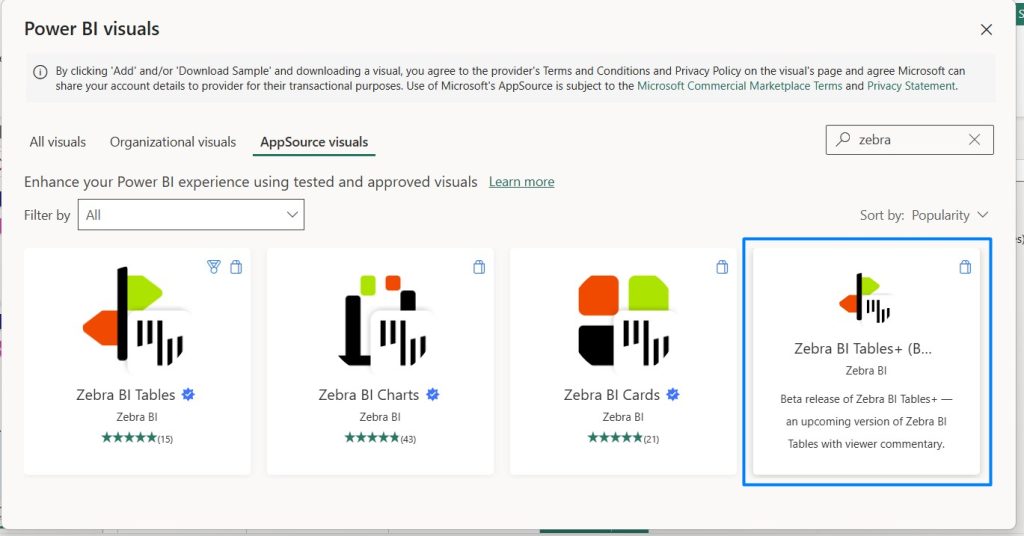
As these are completely new visuals, you will need to add Tables+ and Charts+ from the Appsource store or the Organizational store.
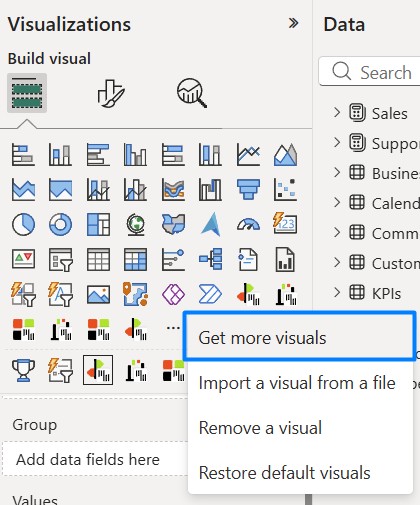
Type “Zebra” under search and look for Tables+ and Charts+. The functionality of both visuals remains exactly the same as in standard Tables and Charts, except for this feature.
Open a report, add the visual to the canvas, and insert your data in the visual. The annotation icon in the visual toolbar allows report editors to access commenting settings.
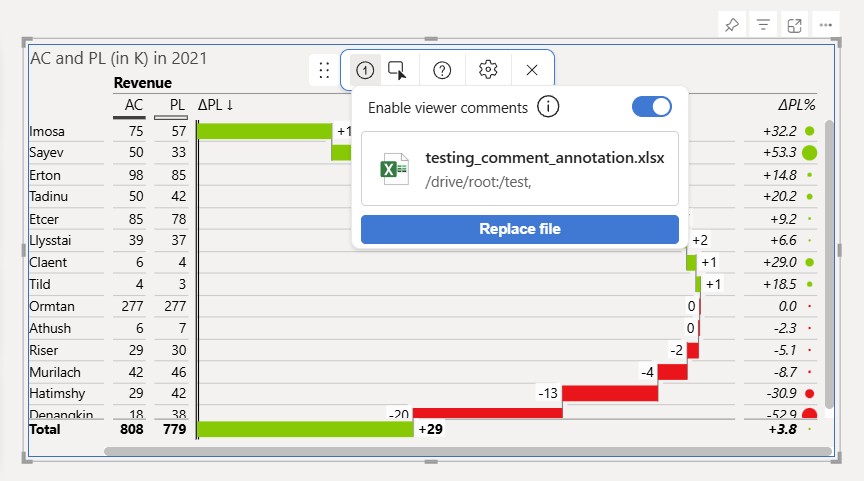
Pressing on the gear icon gives an option to “Enable viewer comments“
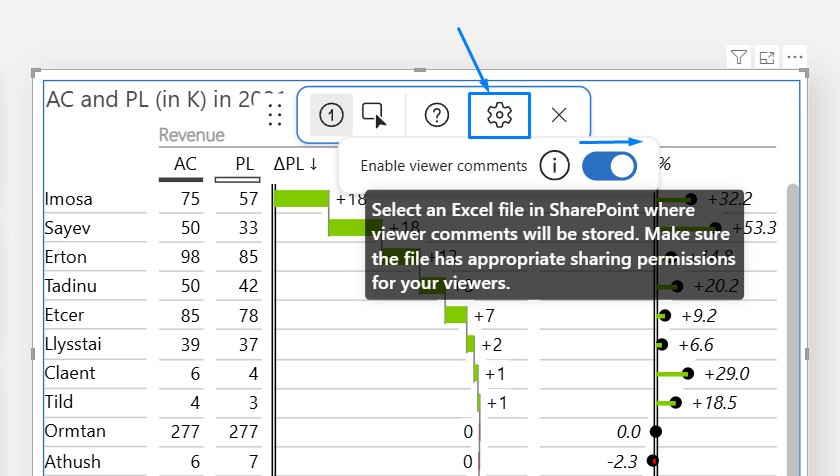
The SharePoint file picker allows you to select an Excel file from a SharePoint location.
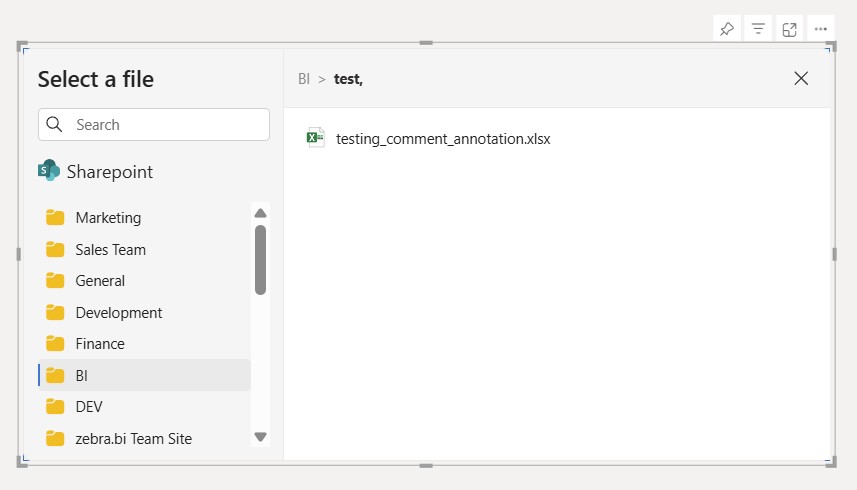
After selecting a linked SharePoint file will be shown in the settings pane.
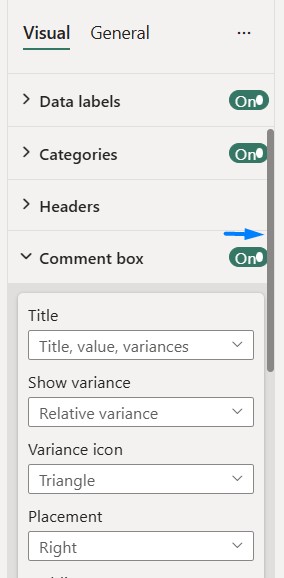
The last step to set this up for report viewers is turning Comment box -> ON. Go under settings and enable this option.
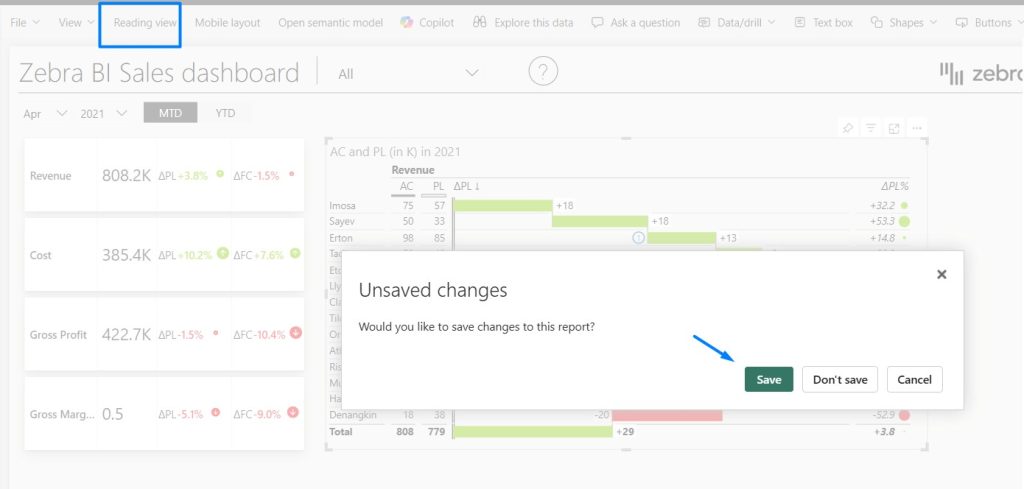
Save the file (in Power BI Service) before returning to the Reading view.
🔥Report editors maintain full access to all comments and can delete any comment from other users.
Report Viewers
Open and sign into Power BI – https://app.powerbi.com/
Once a visual is linked to a SharePoint file, any user with access to that file will see the annotation layer icon in the top-right corner.
Click on the comment marker icon
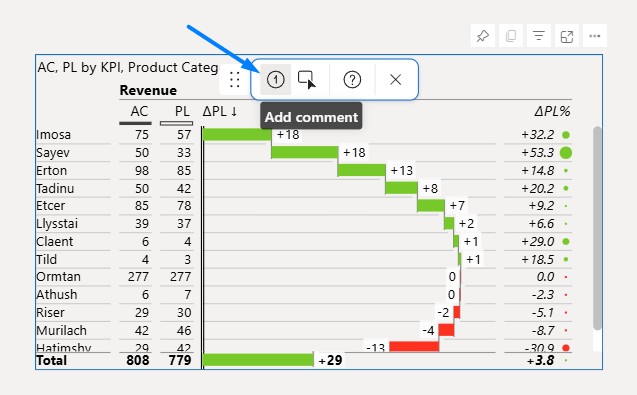
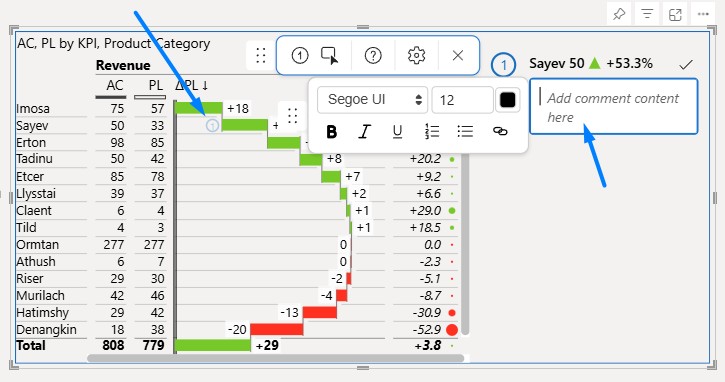
Place a comment on any datapoint within a visual, and a comment box will appear on the right side for you to insert a comment.
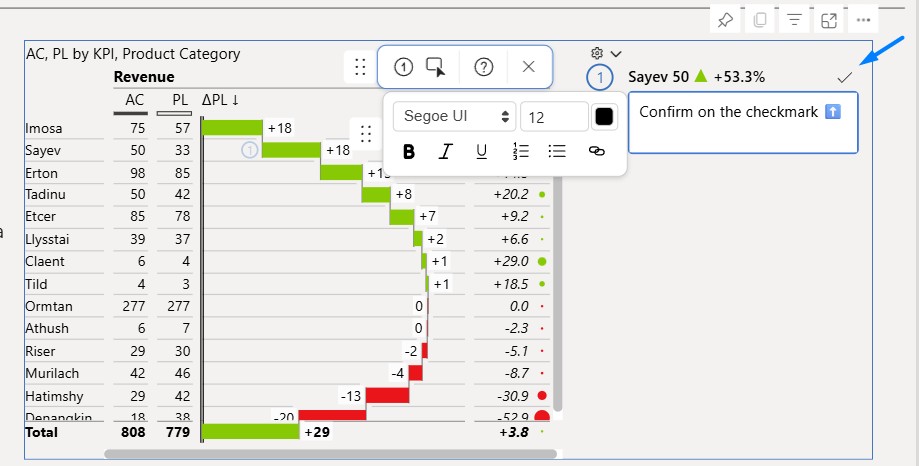
Confirm a comment by clicking on a checkmark. If a viewer doesn’t have access to a certain SharePoint location, they will not see the existing comments in a visual and will not be able to add a comment (by confirming) in the visual.
How do comments load in the visual
Comments are loaded from SharePoint each time the visual is opened or refreshed. This occurs when:
- A user opens the report page
- A slicer is changed, or the filter context changes
- The user switches report tabs
- The browser page is refreshed
- Comments are not shown in real time. If a colleague adds a comment while you have the report open, you will see it after your next visual refresh ⬆️