By default, hierarchical tables are often sorted using a single sort logic across all levels. In some business scenarios, however, each level of the hierarchy may need its own sorting logic.
Example Use Cases
- Financial statements
- Product hierarchies
- Organizational structures
- Sales reporting
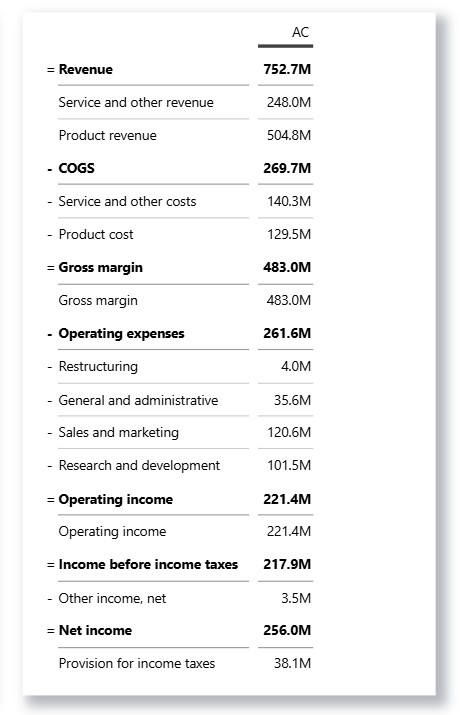
Financial statement example
Desired sorting:
- Level 1 (Account Groups): custom financial statement order
- Revenue
- COGS
- Gross Profit
- Operating Expenses
- Level 2 (Accounts): sorted by Actual Value descending within each section
In the example below, we can see that the visual has custom sorting applied by Account group and Account IDs, while we want to have Level 2 sorted by AC Value.
How to apply
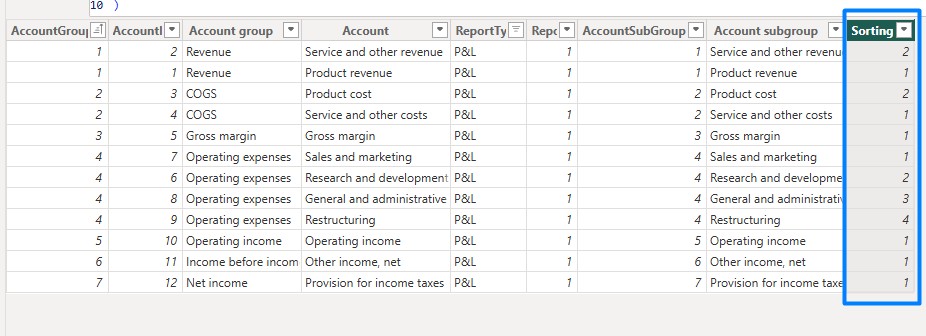
To get the desired sorting, we will add a calculated column to the dimension table with accounts, following the DAX measure below:
Sorting Nr =
RANKX (
    FILTER (
        Accounts,
        Accounts[Account group] = EARLIER ( Accounts[Account group] )
    ),
    [Value AC],
    ,
    DESC
)
This calculated column ranks each account based on its [Value AC] value relative to other accounts in the same Account Group. The highest value within a group gets rank 1, the second-highest gets rank 2, and so on. The ranking restarts for each Account Group and can be used as a custom sort order for accounts within the group.
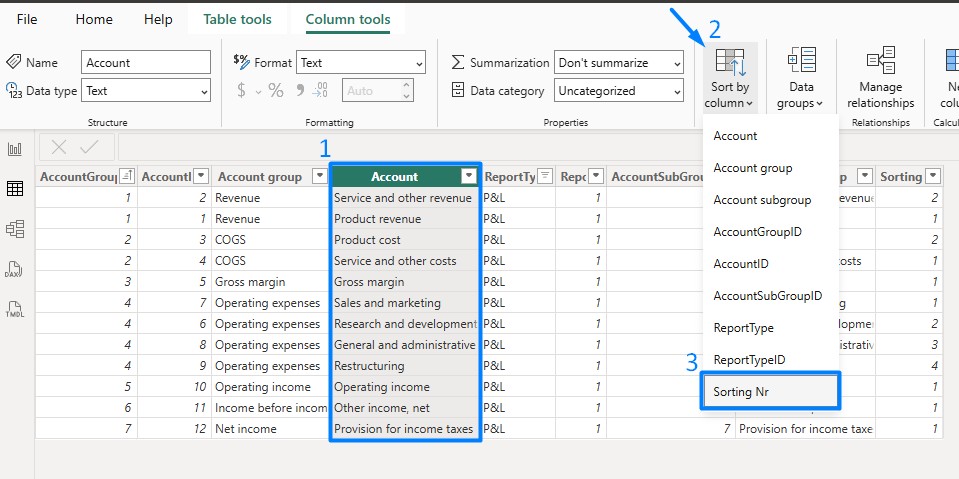
After that, we can then apply Sort by column (calculated column) to the Account column.
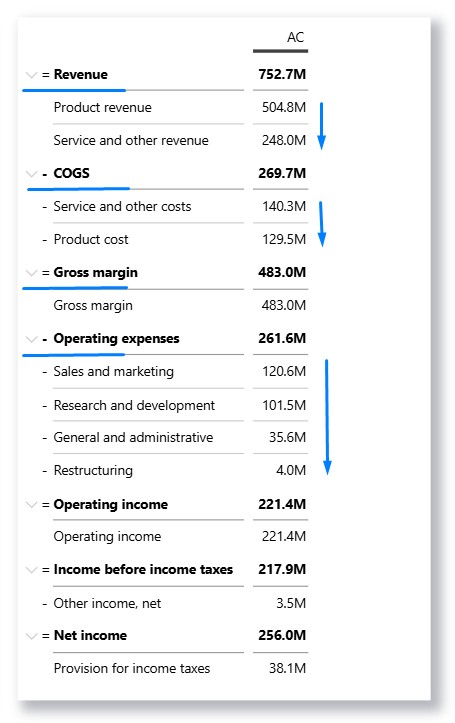
And now the accounts in our visual have been sorted as desired:
Summary
Custom sorting improves report readability by displaying items in a meaningful business order, helping users identify key insights faster and navigate data more efficiently.