



Zebra BI Tables gives you two choices about how it handles your data: how it loads a hierarchy from Power BI, and how far it calculates on top of what the model delivers. Together they decide how fast the visual opens, whether your subtotals are recalculated or taken as they are, and how unbalanced (ragged) hierarchies are handled. This article explains both settings, helps you pick the right combination, and covers how to deal with ragged data.
The Data loading setting
Open Format your visual > Data loading, the setting has two options:
| Setting | The question it answers | Values |
|---|---|---|
| How hierarchies load | Where do the rows come from? | Level by level · All at once |
| Calculate | Where do the subtotals come from? | From the lowest level · From the marked level only · Not at all |
They work independently. You can combine them in different ways to match your data and your report.
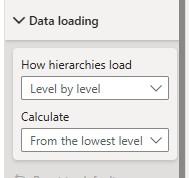
How hierarchies load
How hierarchies load sets when Zebra BI asks Power BI for the rows underneath a hierarchy.
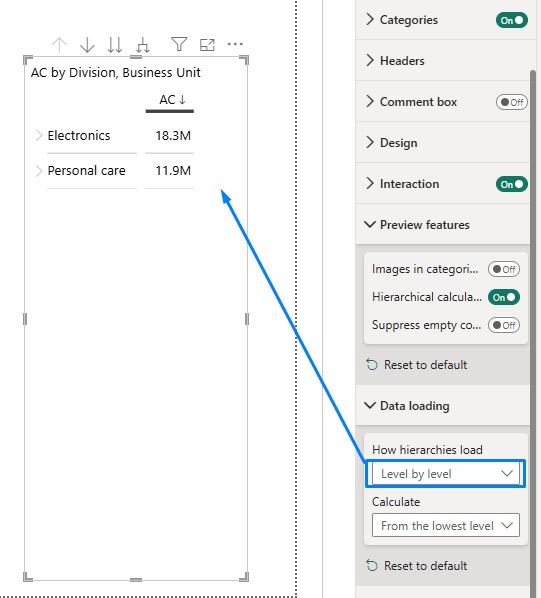
Level by level Zebra BI fetches each level as it is opened. The visual opens quickly and the native Power BI drill buttons keep working. The trade-off: rows that have no children of their own repeat at every level (see ragged hierarchies below).
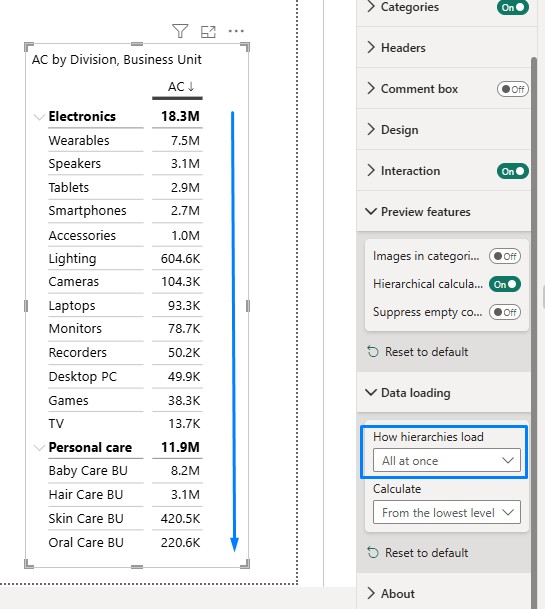
All at once Zebra BI fetches the whole hierarchy up front. It takes longer to open, but rows with no children of their own are recognized and merged into one. The native drill up/down arrows don’t work with this option. Right-click a row and choose expand or collapse instead.
Tip: Choose based on the shape and size of your hierarchy, not your storage mode.
Calculate
Zebra BI can do its own calculations on your rows: subtotals for inverts, results, skips and formulas. Calculate sets how far it goes.
| Value | What it does | Good for |
|---|---|---|
| From the lowest level | Builds every subtotal from the individual rows. Most accurate. Zebra BI also fetches collapsed rows it needs, so more data loads than you opened. | Most reports |
| From the marked level only | Calculates where the mark sits and takes collapsed subtotals from Power BI. Much faster, but numbers can change as a user expands. | Large hierarchies where speed matters |
| Not at all | Every number stays exactly as your model delivers it. Calculations like Invert, Result, and Skip become formatting only. | Reports where the model already carries every total |
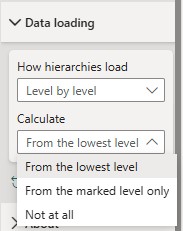
Under All at once, Calculate offers two values: From the lowest level and Not at all. Every row is already loaded, so there is nothing left for the middle option to skip.
What “Not at all” does
With Not at all, Zebra BI formats but doesn’t calculate. Use it when your model already contains the correct totals and you only want Zebra BI’s notation (result rows, inverts, colors) on top of them.
| You set | With Not at all |
|---|---|
| Invert on a row | The number is left alone. The invert marker still shows and the variance colors still flip. |
| Mark as result | The row keeps its result formatting and “=” mark, and shows the model’s number. |
| Subtotals in a hierarchy | Every level shows the model’s number. |
| Grand total | Unchanged. Tables already take it from the model. |
| Skip | There is no total being worked out, so the mark has no effect. |
| Formula rows | [CHECK: keep calculating, or come out empty? PRD calls keeping formulas the intended exception, since the model has no number to fall back on.] |
| Comparisons and variances | Unchanged. Not at all governs row calculations only. |
Which settings should you pick?
| Your situation | How hierarchies load | Calculate |
|---|---|---|
| Standard report, balanced hierarchy | Level by level | From the lowest level |
| Hierarchy with uneven depth, and you want it merged automatically | All at once | From the lowest level |
| Very large hierarchy, the report is slow | Level by level | From the marked level only |
| Model already has correct subtotals and totals, you want Zebra BI’s formatting only | Either | Not at all |
Ragged (unbalanced) hierarchies
A ragged, or unbalanced, hierarchy is a user-defined hierarchy that has an uneven number of levels. Some branches stop earlier than others. Typical examples:
- A time hierarchy where some branches stop at the quarter level while others continue to months.
- An organizational structure where some teams have an extra layer of management.
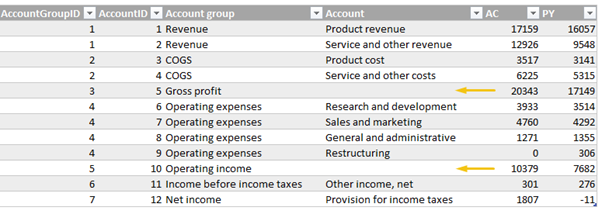
- An income statement where some accounts, like Gross margin, have no subcategories while others do.

With Level by level, a row with no children of its own can repeat at every level below it and show a drill-down option that leads nowhere
A path to fix this is to switch to All at once option. Ragged branches are detected and merged into one row, with no changes to your data. The cost is a slower first load and right-click expand/collapse instead of drill arrows.

How to set fix ragged hierarchies in Power Query
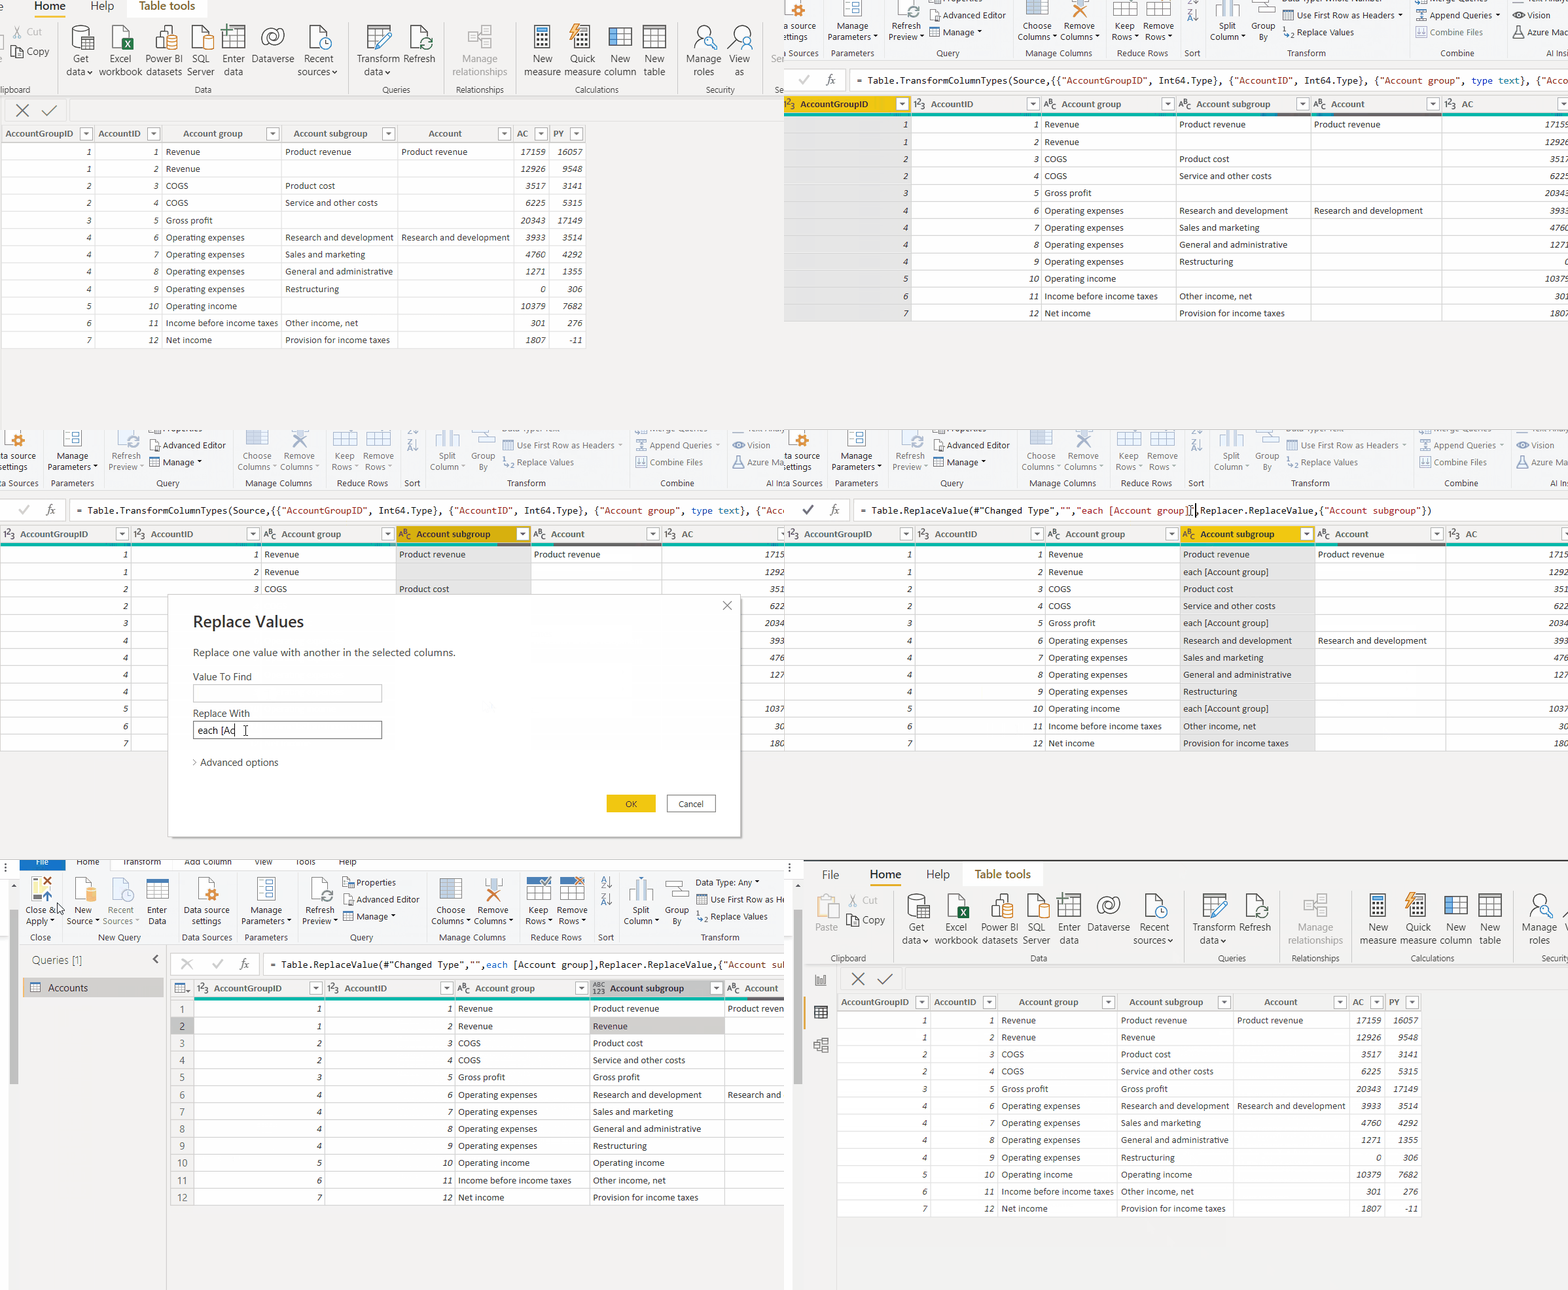
Fill each blank level with the value from the level above, so Zebra BI sees the row as ending there.
Say your hierarchy has a Category and a Subcategory, and some rows have no Subcategory:
- In Power BI, click Transform data to open the Power Query Editor.
- Right-click the column with blank cells (here Subcategory) and select Replace Values.
- In the Replace With window, leave “Value To Find” empty and enter
each [Category]in the replacement field, where Category is the parent-level column. - Click OK, then Close & Apply.
Existing reports
If you built a report before Zebra BI Tables 8.4.2, you don’t need to take any action. It is converted to the matching pair of settings and behaves exactly as it did:
| Before | Now |
|---|---|
| Importing, live connections and drill down | Level by level + From the lowest level |
| DirectQuery and ragged hierarchies | All at once + From the lowest level |
| Shallow calculations | Level by level + From the marked level only |